

DATA PROCESSING TIMESWhile most reports generate within 1-2 hours, it can take up to 10 hours to generate larger reports. Reports are generated using data that updates once per day. Depending on when the underlying data updates, you may see stale data requiring you to trigger the report to run again.
Standard reports
Standard reports are pre-defined reports you can trigger to run from the Reports tab in the Metronome app. Once triggered, the report generates and you receive an email confirmation with a link to download the resulting report in the UI as a CSV file. Included standard reports:
To trigger a standard report to run, visit the Reports tab in the Metronome app, select the report from the dropdown, enter filtering dates and click Generate Report.
After a report completes, you’ll receive an email confirmation with a link to download the resulting report in a CSV format from the Reports tab in the Metronome app.
Custom reports
NOTECustom reports is a paid feature. If you’re interested in learning more about this feature, contact solutions@metronome.com.
- Contact us via the Metronome support portal to request a custom report
- Share detailed requirements about your reporting needs (e.g. end of month books close, customer cohorting, etc.)
- Review sample data with the Metronome team
- Approve the resulting data
- Confirm how you want to trigger the reports (you can either trigger the report from the Metronome App or schedule via cron)
In-app dashboards
In-app dashboards are currently in beta. Contact us via the Metronome support portal to have them turned on for your account.
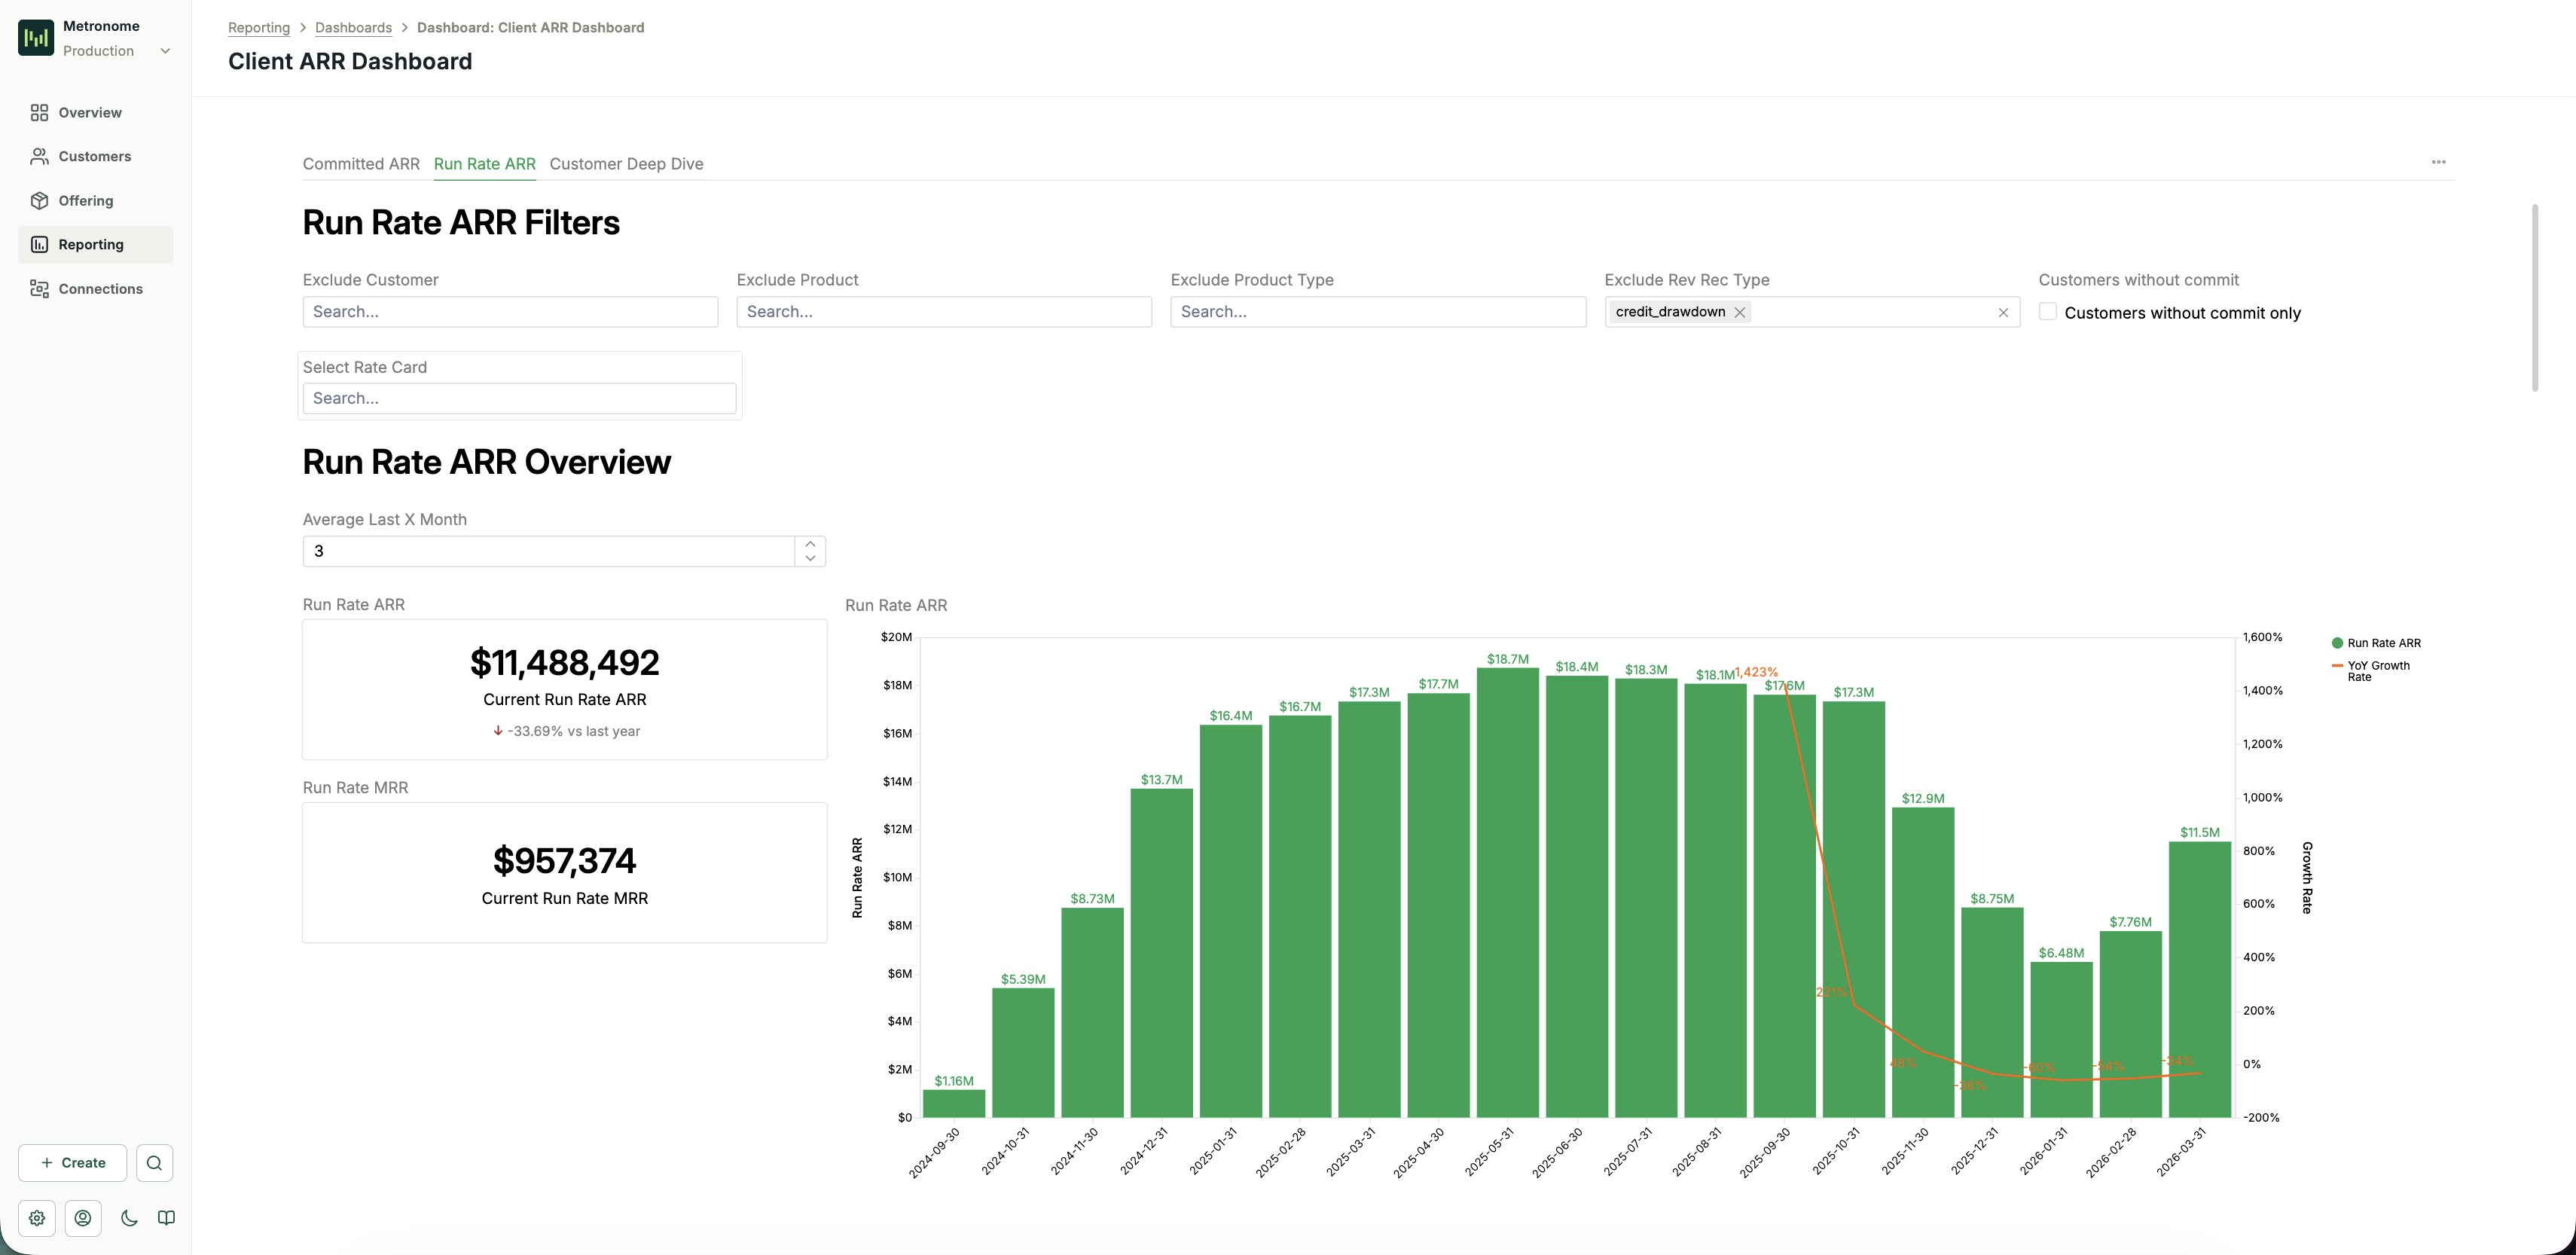
Committed & Run Rate ARR Dashboard
The Committed & Run Rate ARR Dashboard surfaces the key financial metrics consumption businesses use to track growth and retention. The sections below describe how each metric is defined and computed.Metrics definitions
Committed ARR Committed ARR measures the contractually committed revenue from customers, including usage commitments and scheduled charges. It is derived fromscheduled_charges and balances in your Metronome data.
- Balances (commits and credits): Schedule items are unnested to extract individual commitment periods with their amounts and date ranges. ARR is calculated by dividing each schedule item’s amount by its duration in days, then annualizing:
(amount / duration_days) × 365. For CPU commits, amounts are converted to dollars using the corresponding rate card conversion. - Scheduled charges: Schedule items are unnested to sum the total amount per charge over its contract period (
starting_attoending_before). ARR is calculated by dividing the total amount by the duration in days, then annualizing.
run_rate_ARR = average monthly revenue across the last 3 months × 12. Usage and subscription line items are used to calculate usage revenue.
Methodology notes:
- For customers with less than X months of history, whatever months are available are used to calculate the moving average MRR.
- Run Rate ARR continues to be calculated for churned customers. If a customer’s latest month’s usage is
$0, the run rate MRR is still the average across the last X months.
ARR movement
All metrics compare the current period to the base period (X months ago, configurable).- New ARR: ARR from customers who had
$0ARR (or didn’t exist) in the base period but have ARR> $0in the current period. - Expansion ARR: Additional ARR from existing customers whose ARR grew (current ARR
>base period ARR). This is the difference between current and base. - Contraction ARR: Lost ARR from existing customers whose ARR decreased (base period ARR
>current ARR, but current ARR> $0). This is the difference between base and current. - Churned ARR: The full base period ARR from customers who had ARR
> $0in the base period but have$0ARR in the current period.
Revenue retention
- GRR (Gross Revenue Retention): The percentage of base period ARR retained, excluding expansion.
- Formula:
retained_arr / starting_arr - Where
retained_arr = min(current ARR, base ARR)for each customer. - GRR
< 100%means revenue was lost through contraction and churn.
- Formula:
- NRR (Net Revenue Retention): The percentage the base cohort’s ARR grew to, including expansion.
- Formula:
ending_arr_from_base_cohort / starting_arr - Where
ending_arr_from_base_cohortis the current ARR for customers who existed in the base period. - NRR
> 100%means expansion exceeded contraction and churn. - NRR
< 100%means contraction and churn exceeded expansion.
- Formula:
Customer/logo movement
- New customers: Customers who had
$0ARR (or didn’t exist) in the base period but have ARR> $0in the current period. - Expanding customers: Existing customers whose ARR grew (current ARR
>base period ARR). - Retained customers: Existing customers whose ARR stayed exactly the same (current ARR
=base period ARR). - Contracting customers: Existing customers whose ARR decreased but still have ARR
> $0(base ARR>current ARR> $0). - Churned customers: Customers who had ARR
> $0in the base period but have$0ARR in the current period. - Active customers: Total count of customers with ARR
> $0in the current period, regardless of base period status.
Available filters
Committed ARR tab These filters apply to the combined scheduled charges and commits dataset.
Run Rate ARR tab
These filters apply to the usage-based revenue dataset. A hardcoded filter also restricts data to completed months only (month
< current month start).
Caveats
- Only contract data and finalized invoices are used.
- All invoices are prorated by day, so invoices spanning multiple months are split across those months.
- Non-USD fiat currencies are not supported.