How Metronome works
Understand the core parts of Metronome
Quickstart guide
Get to your first invoice on Metronome
Plan your billing architecture
What to keep in mind as you create your billing architecture
Build your pricing and packaging
- Pay-as-you-go billing
- Enterprise commits
- Subscriptions w/ usage
- Pre-paid credits
Pay-as-you-go billing
Set up Metronome to support charging your customers in arrears for
only what they use.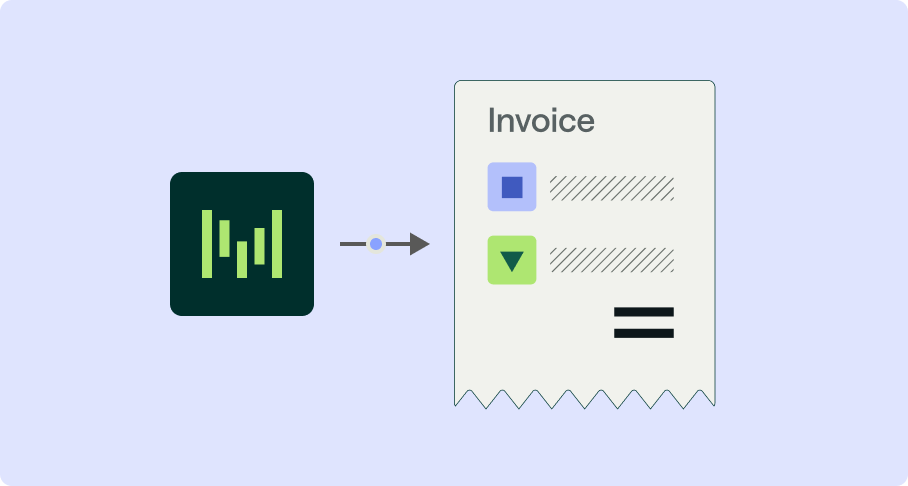
Get started with

Contracts
Invoicing