- Billable metrics are associated with products, which is where you set the presentation layer for how line items should be displayed on an invoice.
- List prices are defined for products as rates on a rate card.
- Rates can be associated or overwritten on a contract, which is where invoices are generated for each Metronome customer. Quantities for each of the line items are calculated from events using the billable metric definition.
- Identify usage components to price on.
- Identify the desired scale and latency needed for invoice calculations.
- Define
Group keysto organize your metric data. - Define filters and an aggregation strategy to identify and accumulate relevant events from your usage stream.
1. Identify usage components
Before implementing your billable metrics, determine the factors that contribute to your usage-based billing. You should consider what aspects of your service your customers value most, what they would expect to see on a final invoice, and what data elements you have available to send to Metronome. Some example metrics may include:- Number of API calls
- Number of input and output tokens consumed
- Storage used (GB hours)
- Number of users
2. Identify desired scale and latency
Before implementing your billable metrics, consider the scale of events that you send to Metronome for a particular metric. Metronome offers two types of billable metrics:- Streaming billable metrics : metrics designed for ultra low latency and high throughput workflows. Use Streaming billable metrics if:
- Your metric definitions can be defined through a set of simple filters and aggregations (e.g. COUNT, SUM, or MAX).
- You require real-time alerting across a wide customer base with a high event volume.
INFOWhen using streaming billable metrics, the billable metric must be defined in Metronome before any usage can be associated with it. If usage is sent in before a streaming metric is defined, it isn’t attributed to the metric by default. Reach out to your Metronome representative if you would like to retroactively associate events with new streaming billable metrics.
- SQL billable metrics : metrics designed with SQL queries to support more complex calculations.
- Used if the desired billable metrics are not satisfied by the basic filters provided in streaming billable metrics.
INFOFor many alerting workloads, SQL billable metrics will have comparable performance to streaming billable metrics. For complex queries or high numbers of SQL billable metrics, the Metronome team can help provide guidance to achieve desired latency. Please reach out to your Metronome team if you are interested in using SQL billable metrics with alerts.
3. Define group keys
Group keys are used in Metronome to specify one or more properties that can be used to break out usage in downstream pricing and packaging. This functions similarly to a group by clause in a SQL query. Group keys must first be defined in the metrics layer in order to be available to use in downstream pricing and packaging. A given billable metric can have many group keys.
Group keys help support the following use cases in the platform:
- Presentation group keys allow you to separate out quantities on an invoice by a particular property value.
- For example, if you specify
user_idas a group key, you can display usage on an invoice broken out by eachuser_id. This is useful for attributing spend across a larger organization.
- For example, if you specify
- Pricing group keys form the basis for dimensional pricing and allow you to price a metric differently based on property values.
- For example, if you specify properties
[cloud_service_provider, region]as a group key, you can set up separate rates for events with different values of this property.- Events with properties
cloud_service_provider=awsandregion=us-east-1are priced at $0.50 - Events with property
cloud_service_provider=azureandregion=southindiaare priced at $0.40
- Events with properties
- For example, if you specify properties
user_id and pricing group key on [cloud_service_provider, region] , create a group key on the billable metric that looks like [user_id, cloud_service_provider, region] .
CONFIGURATION NOTEUsing group keys with many possible values for a given customer can increase latency when calling the Metronome API. If you anticipate the cardinality of these possible values reaching one thousand, contact your Metronome representative to discuss your configuration.
Define group keys on streaming billable metrics
Group keys for streaming billable metrics are defined through the basic filters editor, or through the create billable metric API endpoint. To include a property in a group key, it must be first defined in the property filters with anExists or In filter. Group keys are not editable once a metric is created, so it is important to consider if they are needed for your invoice presentation or pricing when creating your billable metrics.
Define group keys on SQL billable metrics
When defining a SQL billable metric, any property returned by your SQL query outside of thevalue column can be used as a group key. For example, to use the property user_id as a presentation group key, and region as a pricing group key, your SQL query may look like:
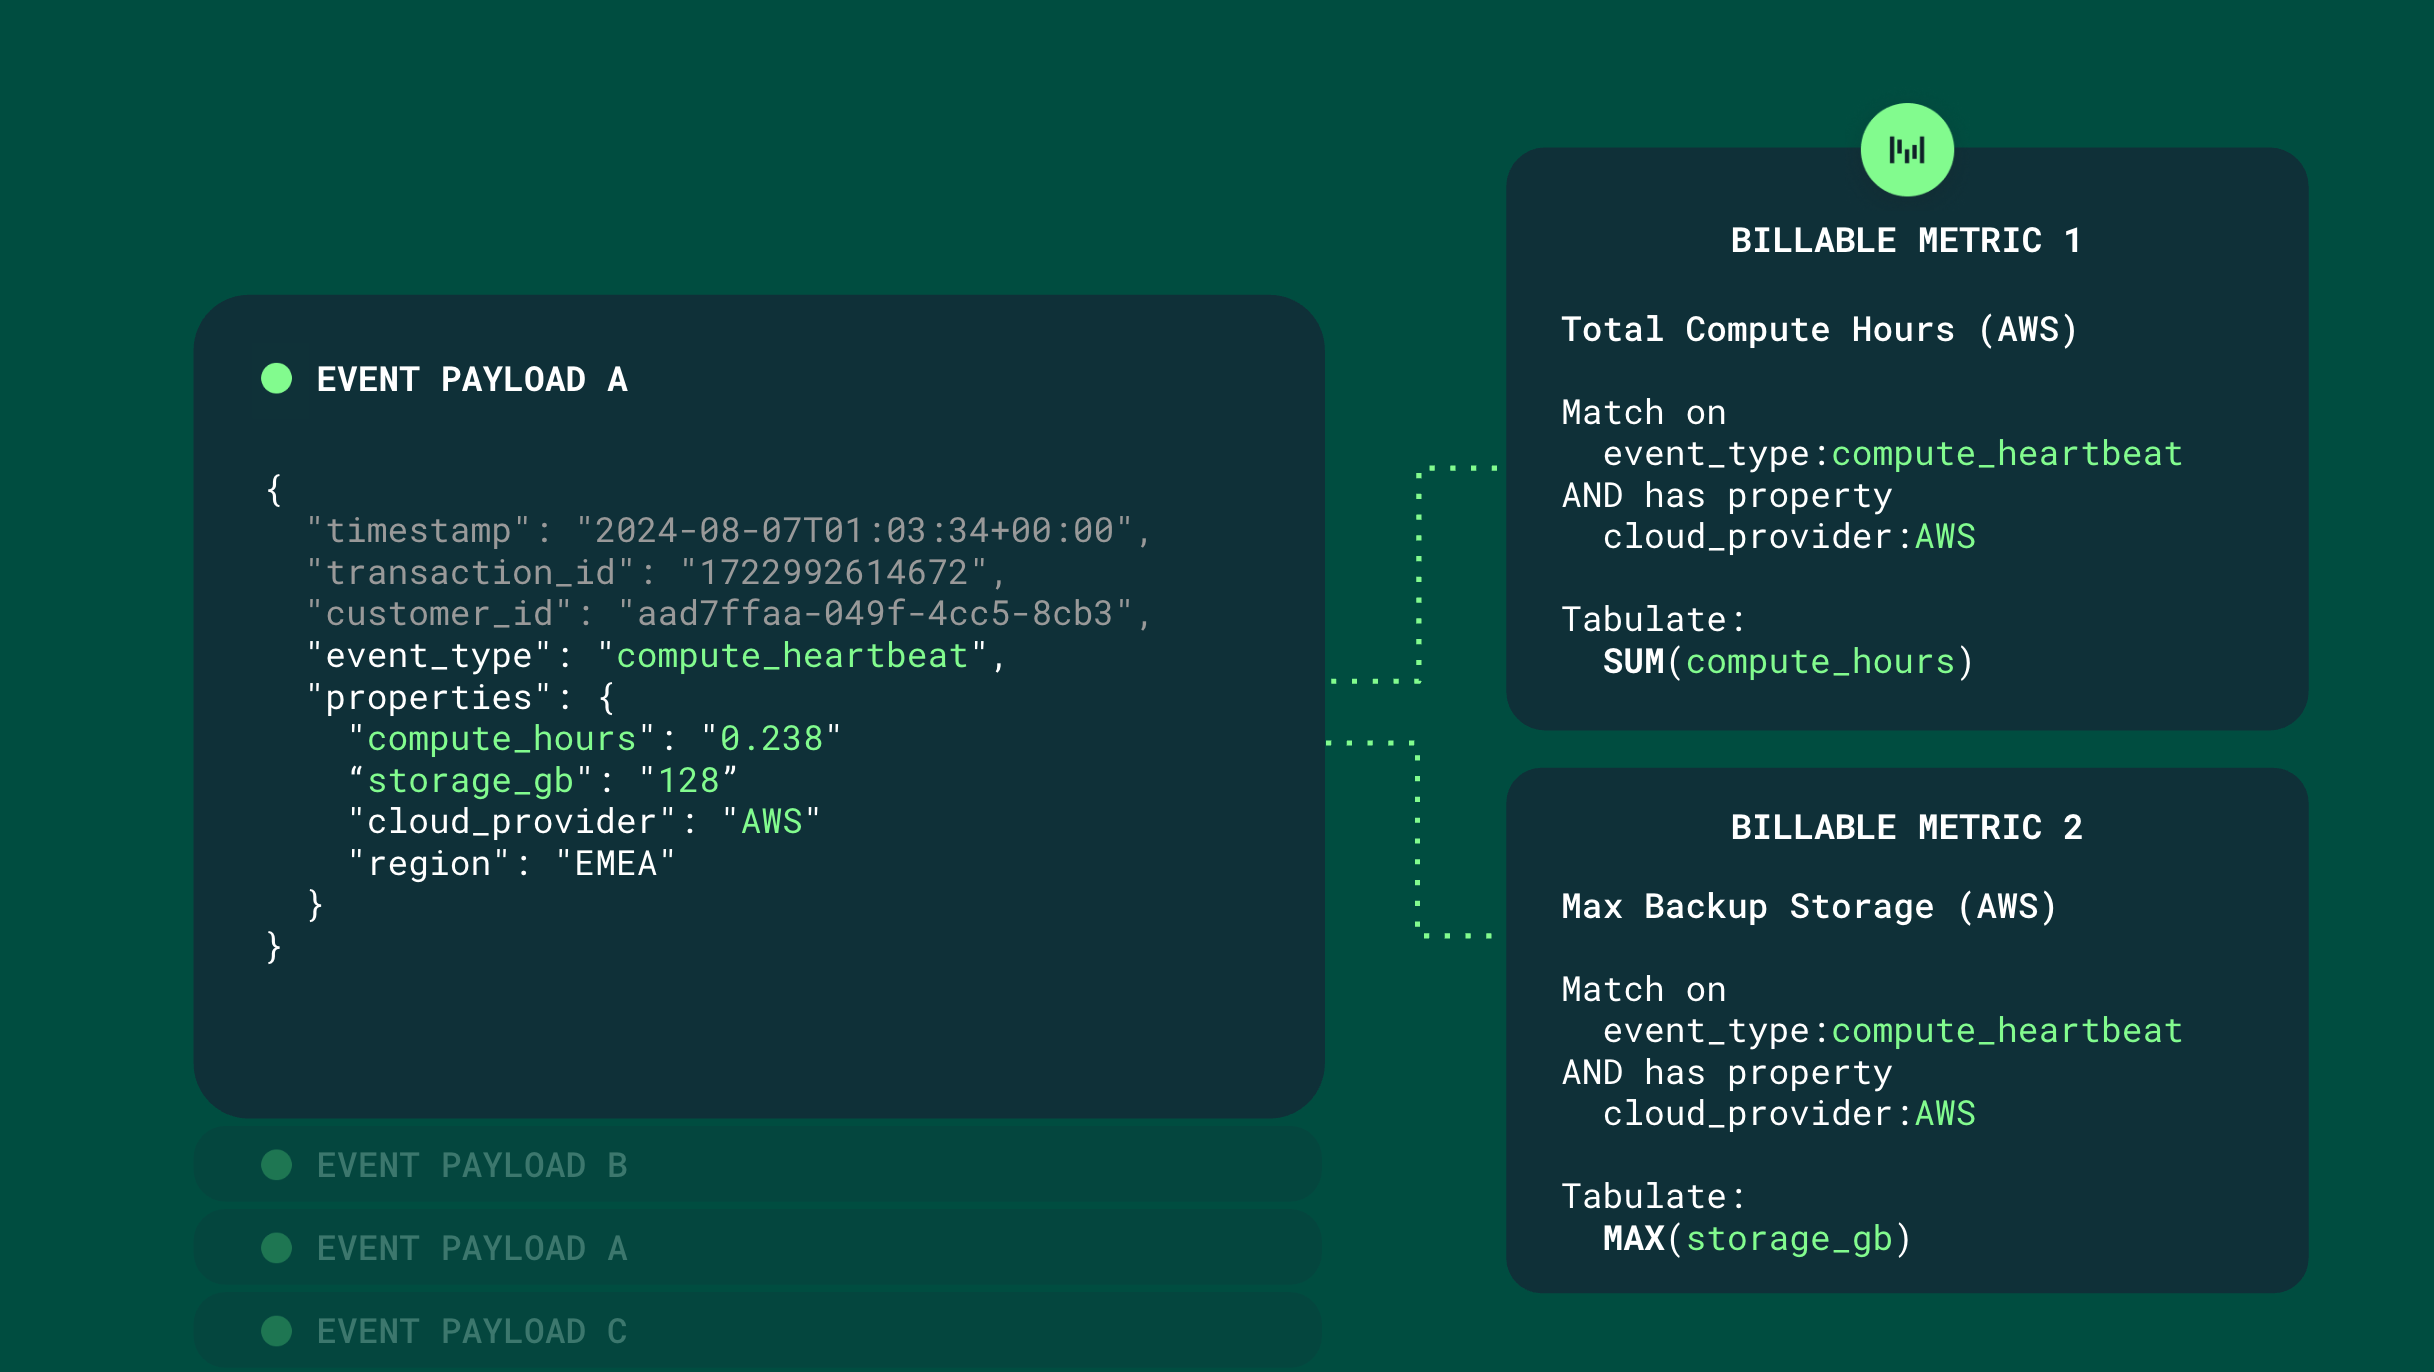
4. Define filters and aggregations for relevant events
Once you have the pricing elements from your usage stream that you would like to see represented in Metronome, you must implement your billable metric definition. Metronome offers two tools for defining Billable Metrics:- Basic Filters editor A user-friendly interface with predefined filters and aggregations, suitable for most basic use cases.
INFOAll metrics created with the Basic Filters editor are created as streaming billable metrics.
- SQL Editor A more flexible option allowing custom SQL queries for complex scenarios. All metrics created with the SQL editor are created as SQL billable metrics.
5. Send and trace events to test your billable metric
Once you’ve created your billable metric, send some events to make sure they are correctly matching as expected. Use the ingest endpoint to send your test events, then call the searchEvents endpoint with the events’transaction_ids. The response contains the list of matched billable metrics, as well as the matched customer if it exists. If you’ve set up a matching customer and matching billable metric, but do not see these values populated, you can dig into the billable metric definition to see if anything is incorrectly defined.