> ## Documentation Index
> Fetch the complete documentation index at: https://docs.metronome.com/llms.txt
> Use this file to discover all available pages before exploring further.
# Get commit and usage analytics
This guide will walk you through building internal dashboards that empower your GTM teams to proactively monitor customer usage patterns and commit consumption, enabling timely interventions that prevent overspend surprises and improve customer retention.
**Time to complete:** 2-3 hours for initial setup, plus ongoing refinement
**Prerequisites:**
* Data Export enabled and sending data to your internal warehouse or lakehouse
* Access to business intelligence tool (e.g., Looker, PowerBI, Hex) with ability to query Metronome tables
* At least one customer with an active commit
**Key benefits:**
* Prevent customer churn from unexpected overspend
* Identify expansion opportunities from usage patterns
* Enable proactive customer success engagement
## Before You Begin
### Required Access & Permissions
**Role needed:** Admin or Analyst role in Metronome
**Permissions:**
* View customer contracts and commits
* Access Data Export configurations
* Create and schedule data exports
**Data requirements:** At least 7 days of usage data for meaningful insights
### Understanding Your Data
Metronome's [Data Export](/guides/reporting-insights/data-export) feature provides daily exports of Metronome data to your warehouse of choice. The data models include customer informatoin, granular usage and commit data, contract details, and more.
## Step-by-Step Implementation
### Step 1: Configure Data Export
**PAID FEATURE**
Data Export is a paid Metronome feature. Contact your Metronome representative to enable Data Export in your account.
**Objective:** Set up automated data exports to feed your reporting dashboards
**Instructions:**
1. Navigate to Connections > Data Export in the Metronome App
2. Click "Add Destination"
3. Configure your warehouse or lakehouse destination
4. Enable the following tables (note: clients may enable more than the following tables for additional use cases)
* `customer` - All customers
* `contracts` - All Contracts related data models (ask your Metronome rep to enable)
* `invoice` & `line_item` - All finalized invoices and line items
* `draft_invoice` & `draft_line_item` - All draft invoices and line items
**Expected result:** Data models correctly flowing into your destination warehouse or object storage on a daily basis.
### Step 2: Build Customer-level burn curve data models
**Objective:** Build a per-customer commit burn curve with actual and expected burn over time
**Instructions:** To create a commit burn rate curve, we need to combine 2 concepts, how much of a commit *should* be burned and how much of a commit has *actually been* burned. The following queries provide a step-by-step guide to define both concepts using Metronome data export data.
**GENERALIZED SQL**
The SQL used here is generalized SQL and will most likely not run in your query engine as-is. Python and SQL can both be used for the creation of these dashboards.
1. **Create pacing rate from `access_schedule` in the `contracts_balances` table:**
The following query parses the access schedule JSON object from the `contracts_balances` table to generate the expected burn curve or how much of a commit *should* be burned at any given time.
```sql theme={null}
/*
==============================================================================
SAMPLE QUERY: ACCESS SCHEDULE ANALYSIS
==============================================================================
Purpose: Analyzes access schedules by parsing JSON schedule data and calculating
daily rates, total duration, and normalized balance types.
Tables Required:
- contracts_balances_table: Contains balance information with access_schedule JSON column
==============================================================================
*/
WITH access_schedules AS (
SELECT
-- Extract schedule item details from JSON
JSON_EXTRACT_SCALAR(schedule_item, '$.id') AS access_schedule_id,
id AS balance_id,
-- Convert amount from cents to currency units
CAST(JSON_EXTRACT_SCALAR(schedule_item, '$.amount') AS DOUBLE) / 100 AS schedule_amount_usd,
CAST(JSON_EXTRACT_SCALAR(schedule_item, '$.amount') AS DOUBLE) AS schedule_amount_cents,
-- Parse ISO8601 timestamps to datetime and date
JSON_EXTRACT_SCALAR(schedule_item, '$.date') AS schedule_start_datetime,
JSON_EXTRACT_SCALAR(schedule_item, '$.end_date') AS schedule_end_datetime,
CAST((JSON_EXTRACT_SCALAR(schedule_item, '$.date')) AS DATE) AS schedule_start_date,
CAST((JSON_EXTRACT_SCALAR(schedule_item, '$.end_date')) AS DATE) AS schedule_end_date,
FROM contracts_balances_table
CROSS JOIN UNNEST(
TRY_CAST(
JSON_EXTRACT(JSON_PARSE(access_schedule), '$.schedule_items') AS ARRAY(JSON)
)
) AS schedule_items_table(schedule_item)
),
schedule_duration AS (
SELECT
access_schedule_id,
-- Calculate total days in schedule (inclusive of start and end dates)
DATE_DIFF('day', MIN(schedule_start_date), MAX(schedule_end_date)) + 1 AS total_schedule_days
FROM access_schedules
GROUP BY access_schedule_id
)
SELECT
-- Schedule details
sch.access_schedule_id,
sch.schedule_amount_usd,
sch.schedule_amount_cents,
sch.schedule_start_datetime,
sch.schedule_end_datetime,
sch.schedule_start_date,
sch.schedule_end_date,
-- Duration and rate calculations
dur.total_schedule_days,
sch.schedule_amount_usd / dur.total_schedule_days AS daily_rate_usd,
-- Balance information
bal.contract_id,
bal.type AS original_balance_type,
-- Normalized balance type with category
CASE
WHEN (bal.type = 'prepaid'
AND JSON_ARRAY_LENGTH(JSON_EXTRACT(JSON_PARSE(bal.invoice_schedule), '$.schedule_items')) = 0)
THEN CONCAT('free_commit')
ELSE bal.type
-- your metronome instance may have other balance types
END AS normalized_balance_type,
-- Invoice schedule metadata
bal.invoice_schedule,
JSON_ARRAY_LENGTH(JSON_EXTRACT(JSON_PARSE(bal.invoice_schedule), '$.schedule_items')) = 0 AS has_empty_invoice_schedule
FROM access_schedules acs
LEFT JOIN schedule_duration dur
ON dur.access_schedule_id = acs.access_schedule_id
LEFT JOIN balances_table bal
ON acs.balance_id = bal.id
```
2. **Calculate historical consumption using the invoice `line_item` table:**
The following query parses invoice line item data to determine how much of the commit was *actually* burned in a given month. This query only parses finalized invoices and will later need to be joined against the draft invoice data to build an up to date view of the remaining commit.
```sql theme={null}
/*
==============================================================================
SAMPLE QUERY: FINALIZED INVOICE LINE ITEM ANALYSIS
==============================================================================
Purpose: Analyzes finalized invoices and their line items to categorize spend types,
calculate usage amounts, and identify commit vs on-demand usage patterns.
Tables Required:
- invoice_table: Contains invoice data with timestamps and status
- line_item_table: Contains detailed line items linked to invoices
- customer_table: Contains customer details
Parameters to Replace:
- {{line_item_types}} → comma-separated list of relevant line item types
==============================================================================
*/
WITH line_items AS (
SELECT
li.*
FROM line_items_table li
INNER JOIN invoices_table inv
ON li.invoice_id = inv.id
AND inv.status = 'FINALIZED' -- Filter to finalized invoices only
)
SELECT
-- Date and time breakdowns
CAST(inv.start_timestamp AS DATE) AS invoice_start_date,
CAST(inv.end_timestamp AS DATE) AS invoice_end_date,
DATE_TRUNC('month', inv.start_timestamp) AS invoice_start_month,
-- Customer information
inv.customer_id,
cust.customer_name,
-- Balance and commit tracking
li.commit_id AS balance_id,
li.commit_id IS NOT NULL AS is_burning_commit,
-- Invoice details
inv.id AS invoice_id,
inv.issued_at AS invoice_issued_at,
inv.status AS invoice_status,
inv.billable_status AS invoice_billable_status,
-- Line item details
li.id AS invoice_line_item_id,
li.product_id,
li.name AS product_name,
li.quantity AS line_item_quantity,
li.unit_price AS line_item_price,
li.total AS line_item_total_amount_cents,
li.total / 100.0 AS line_item_total_amount_usd,
li.commit_id IS NULL AS is_on_demand_usage,
-- Audit timestamps
inv.updated_at AS invoice_updated_at,
li.updated_at AS line_items_updated_at,
FROM invoices_table inv
INNER JOIN line_items li
ON inv.id = li.invoice_id
AND li.line_item_type IN ({{line_item_types}}) -- Filter by Line Item Types that are appropriately contribute to Burn e.g., 'ContractUsageLineItem'
LEFT JOIN customer_table cust
ON cust.customer_id = inv.customer_id
```
3. **Calculate current month consumption using the draft invoice `draft_line_item` table:**
The previous query provides a historical month over month view of commit burn. The following query can be combined with the above to show how the commit has been burned as of the current day in the billing period. The query logic is similar to the finalized `line_item` pattern above, with the only difference being that it pulls intra-month commit data from the `draft_invoice` table.
```sql theme={null}
/*
==============================================================================
SAMPLE QUERY: DRAFT INVOICE LINE ITEM ANALYSIS
==============================================================================
Purpose: Analyzes draft invoices and their line items to categorize spend types,
calculate usage amounts, and identify commit vs on-demand usage patterns
for the current, not finalized, billing period
Tables Required:
- draft_invoice_table: Contains draft invoice data with timestamps and status
- draft_line_item_table: Contains detailed draft line items linked to invoices
- customer_table: Contains customer details
Parameters to Replace:
- {{line_item_types}} → comma-separated list of relevant line item types
==============================================================================
*/
SELECT
-- Date and time breakdowns
CAST(drafts.breakdown_start_timestamp AS DATE) AS breakdown_start_date,
CAST(drafts.breakdown_end_timestamp AS DATE) AS breakdown_end_date,
DATE_TRUNC('month', drafts.breakdown_start_timestamp) AS breakdown_start_month,
-- Customer information
drafts.customer_id,
cust.customer_name,
-- Balance and commit tracking
dli.commit_id AS balance_id,
dli.commit_id IS NOT NULL AS is_burning_commit,
dli.commit_segment_id,
-- Invoice details
drafts.invoice_id,
drafts.issued_at AS invoice_issued_at,
drafts.status AS invoice_status,
drafts.billable_status AS invoice_billable_status,
-- Line item details
dli.id AS breakdown_line_item_id,
dli.product_id,
dli.name AS product_name,
dli.quantity AS line_item_quantity,
dli.unit_price AS line_item_price,
dli.total AS line_item_total_amount,
dli.total / 100.0 AS line_item_total_amount_usd,
dli.commit_id IS NULL AS is_on_demand_usage,
-- Audit timestamps
drafts.updated_at AS invoice_updated_at,
dli.updated_at AS line_items_updated_at
FROM draft_invoice_table drafts
INNER JOIN draft_line_item dli
ON drafts.id = dli.invoice_breakdown_id
AND dli.type IN ({{line_item_types}}) -- Filter by Line Item Types that are appropriately contribute to Burn e.g., 'ContractUsageLineItem'
LEFT JOIN customer_table cust
ON cust.customer_id = drafts.customer_id
```
4. **Combine `access_schedule` , `line_item` , and `draft_line_item` query results and create a date spine:**
There are many ways to achieve this in both SQL and python, and there are also many ways to group this data (i.e. account, industry type, etc), but the important things to flag are:
* `line_item.commit_id` should be joined to `access_schedule.balance_id`
* date\_spine should be created using the `schedule_start_date` and `schedule_end_date`, inclusive of the `schedule_start_date` so that consumption is only measured against the appropriate access schedule service period
* when `line_item.commit_id` is null, this signifies on-demand usage, which can’t tie to a certain commit, thus this usage won’t show up in the burn curve
* cumulative sums on `line_item_total_amount_usd` within an `access_schedule` service period will generate the total burn against a commit by the end of that service period
* `forecast_burn_curve` can be modeled based on the heuristics of your choosing
* the below is an example of what a commit burn rate dashboard could look like
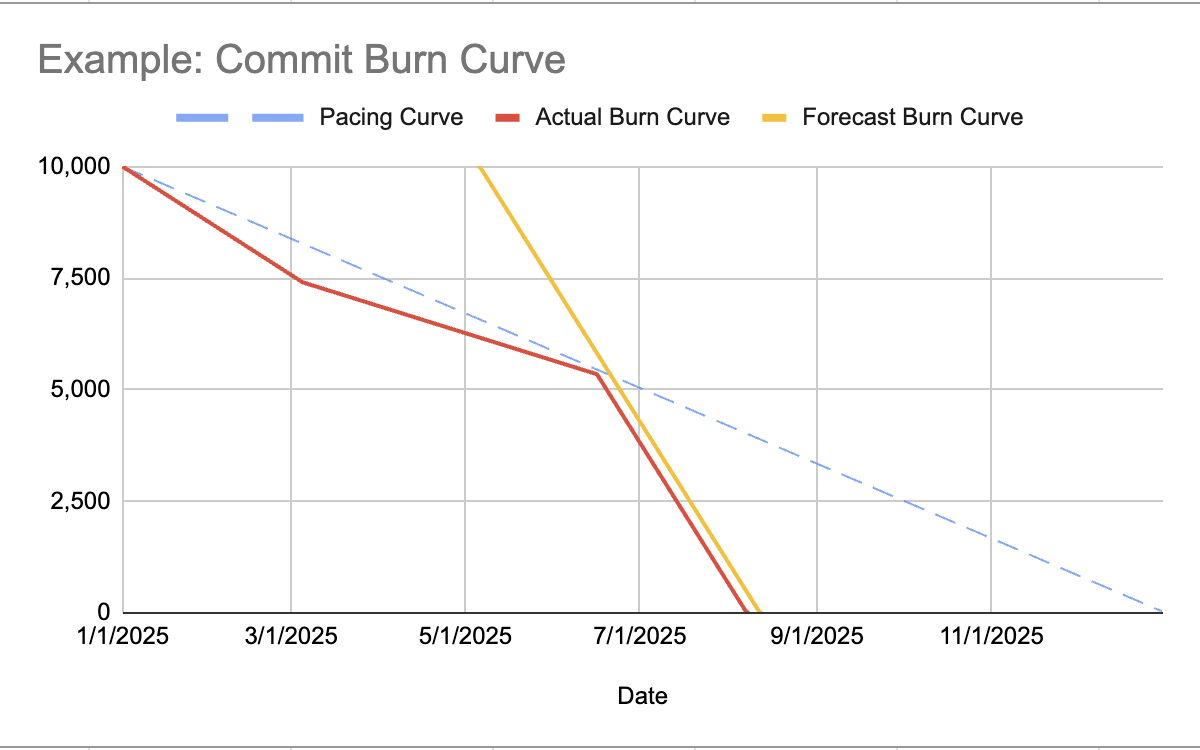 5. **Flag over or under consuming customers:**
Using the pacing curve and the actual burn curve, customers that are burning through their commits faster or slower than anticipated can be flagged. Many Metronome clients use this data to trigger early renewal conversations when a client is over consuming, or product activation conversations when a client is under consuming. A common pattern we’ve seen is to provide each Account Manager or CSM with a dashboard showing their assigned customers and the current state of consumption (over, under, on track).
## Understanding Your Results
### Interpreting the Data
**What to look for:**
* Steady, predictable usage patterns (healthy adoption)
* Gradual usage increases (growing value realization)
* Burn rates between 80-110% (on-track consumption)
**Warning signs or concerning trends:**
* Sudden usage spikes in first 30 days (potential misconfiguration)
* Burn rate greater than 150% before month 3 (unsustainable consumption)
* Repeated spike-and-drop patterns (unstable implementation)
**Common patterns:**
* **Pattern:** 300% burn rate in week 1 → **Action:** Immediate check-in call to review implementation
* **Pattern:** Less than 50% burn rate after 60 days → **Action:** Success team to identify adoption blockers
## Best Practices & Tips
### Optimization Recommendations
* **Frequency:** Review high-risk accounts daily, all accounts weekly
* **Timing:** Metronome exports draft invoice data daily - it’s common for teams producing these dashboards to set SLAs by which their Account Management teams can expect to see fresh consumption data
* **Audience:** CSM team primary, Sales team for expansion and net new opportunities
### Advanced Features
* Predictive modeling using historical seasonal patterns
* Multi-dimensional health scoring incorporating support tickets
* Automated playbook triggers based on usage patterns
### Data Quality Considerations
* Backdated usage can cause temporary spikes—wait 24 hours before escalating
* Price changes mid-period may distort burn calculations
* Always verify anomalies against recent configuration changes
## Integration & Next Steps
### Sharing & Distribution
After the above metrics have been defined, there are many ways to operationalize the data. Included below are a handful of ideas we've seen Metronome clients deploy to help GTM teams prioritize customer reachouts and engagement.
**Internal teams:**
* Automated Slack posts for critical alerts
* Weekly email digest to leadership with at-risk accounts
* Real-time dashboard access for all customer-facing teams
**External stakeholders:**
* Monthly usage reports to customer admins
* Quarterly business reviews with trend analysis
### Taking Action on Insights
1. **Overconsumption:** Schedule immediate call to review usage patterns and optimization opportunities
2. **Underconsumption:** Identify adoption barriers and offer implementation support
3. **Stable high usage:** Proactive expansion conversation before commit exhaustion
## Troubleshooting & FAQ
### Common Issues
**Q: Why does my customer show 500% burn rate on day 2?**
A: New customers often have initial configuration spikes as they're learning to use your platform. We recommend monitoring their usage in this critical period and providing onboarding/implementation guidance to avoid these early costly mistakes.
**Q: Dashboard shows negative commit balance but customer hasn't been notified?**
A: Metronome is a highly flexible system that allows for configurations which would result in negative usage. It’s important to ask your billing team for context if you see abnormal behavior in the commit burn curve visualizations.
### Data Discrepancy Checklist
When report data doesn't match expectations:
* ✓ Verify date ranges align with customer's billing period
* ✓ Review for any backdated usage in past 48 hours
* ✓ Validate commit terms match contract configuration in Metronome (start date, amount, duration)
5. **Flag over or under consuming customers:**
Using the pacing curve and the actual burn curve, customers that are burning through their commits faster or slower than anticipated can be flagged. Many Metronome clients use this data to trigger early renewal conversations when a client is over consuming, or product activation conversations when a client is under consuming. A common pattern we’ve seen is to provide each Account Manager or CSM with a dashboard showing their assigned customers and the current state of consumption (over, under, on track).
## Understanding Your Results
### Interpreting the Data
**What to look for:**
* Steady, predictable usage patterns (healthy adoption)
* Gradual usage increases (growing value realization)
* Burn rates between 80-110% (on-track consumption)
**Warning signs or concerning trends:**
* Sudden usage spikes in first 30 days (potential misconfiguration)
* Burn rate greater than 150% before month 3 (unsustainable consumption)
* Repeated spike-and-drop patterns (unstable implementation)
**Common patterns:**
* **Pattern:** 300% burn rate in week 1 → **Action:** Immediate check-in call to review implementation
* **Pattern:** Less than 50% burn rate after 60 days → **Action:** Success team to identify adoption blockers
## Best Practices & Tips
### Optimization Recommendations
* **Frequency:** Review high-risk accounts daily, all accounts weekly
* **Timing:** Metronome exports draft invoice data daily - it’s common for teams producing these dashboards to set SLAs by which their Account Management teams can expect to see fresh consumption data
* **Audience:** CSM team primary, Sales team for expansion and net new opportunities
### Advanced Features
* Predictive modeling using historical seasonal patterns
* Multi-dimensional health scoring incorporating support tickets
* Automated playbook triggers based on usage patterns
### Data Quality Considerations
* Backdated usage can cause temporary spikes—wait 24 hours before escalating
* Price changes mid-period may distort burn calculations
* Always verify anomalies against recent configuration changes
## Integration & Next Steps
### Sharing & Distribution
After the above metrics have been defined, there are many ways to operationalize the data. Included below are a handful of ideas we've seen Metronome clients deploy to help GTM teams prioritize customer reachouts and engagement.
**Internal teams:**
* Automated Slack posts for critical alerts
* Weekly email digest to leadership with at-risk accounts
* Real-time dashboard access for all customer-facing teams
**External stakeholders:**
* Monthly usage reports to customer admins
* Quarterly business reviews with trend analysis
### Taking Action on Insights
1. **Overconsumption:** Schedule immediate call to review usage patterns and optimization opportunities
2. **Underconsumption:** Identify adoption barriers and offer implementation support
3. **Stable high usage:** Proactive expansion conversation before commit exhaustion
## Troubleshooting & FAQ
### Common Issues
**Q: Why does my customer show 500% burn rate on day 2?**
A: New customers often have initial configuration spikes as they're learning to use your platform. We recommend monitoring their usage in this critical period and providing onboarding/implementation guidance to avoid these early costly mistakes.
**Q: Dashboard shows negative commit balance but customer hasn't been notified?**
A: Metronome is a highly flexible system that allows for configurations which would result in negative usage. It’s important to ask your billing team for context if you see abnormal behavior in the commit burn curve visualizations.
### Data Discrepancy Checklist
When report data doesn't match expectations:
* ✓ Verify date ranges align with customer's billing period
* ✓ Review for any backdated usage in past 48 hours
* ✓ Validate commit terms match contract configuration in Metronome (start date, amount, duration)