> ## Documentation Index
> Fetch the complete documentation index at: https://docs.metronome.com/llms.txt
> Use this file to discover all available pages before exploring further.
# Create streaming billable metrics
export const List = ({marker, children}) => {
return <>
;
};
The streaming`Basic Filters` editor is a structured query builder designed to provide out-of-the-box filters and aggregations on your usage stream. All metrics defined with the Basic Filters editor are created as streaming billable metrics.
Billable metrics can be created in both the [Metronome app](https://app.metronome.com/) or using the [Metronome API](/api-reference/billable-metrics/create-a-billable-metric).
For this example, create a metric to track "API Calls" for a hypothetical cloud service.
1. Navigate to the Billable Metrics section in Metronome.
2. Click `+ Add new Billable Metric`.
3. Choose `Basic filters`.
4. Name your metric (for example, `API Calls`).
5. Select the event type (for example, `api_request`).
6. Set filters:
* **Property 1**
* `property_name`: "status"
* `operator`: "In"
* `value`: "success" (This ensures Metronome only counts successful API calls.)
* **Property 2**
* `property_name`: "user\_id"
* `operator`: "Exists"
* (Metronome uses this as a group key to display API calls broken out by user.)
7. Choose the aggregation method:
* To count the number of API calls, not sum or average them, select "Count".
Streaming billable metrics support four aggregation types: `COUNT`, `SUM`, `MAX`, and `LATEST`. For other aggregation types, such as `UNIQUE`, use a [SQL billable metric](/guides/implement-metronome/core-concepts/billable-metrics-sql-editor).
8. Set a group key for `user_id`.
9. Review and save your metric.
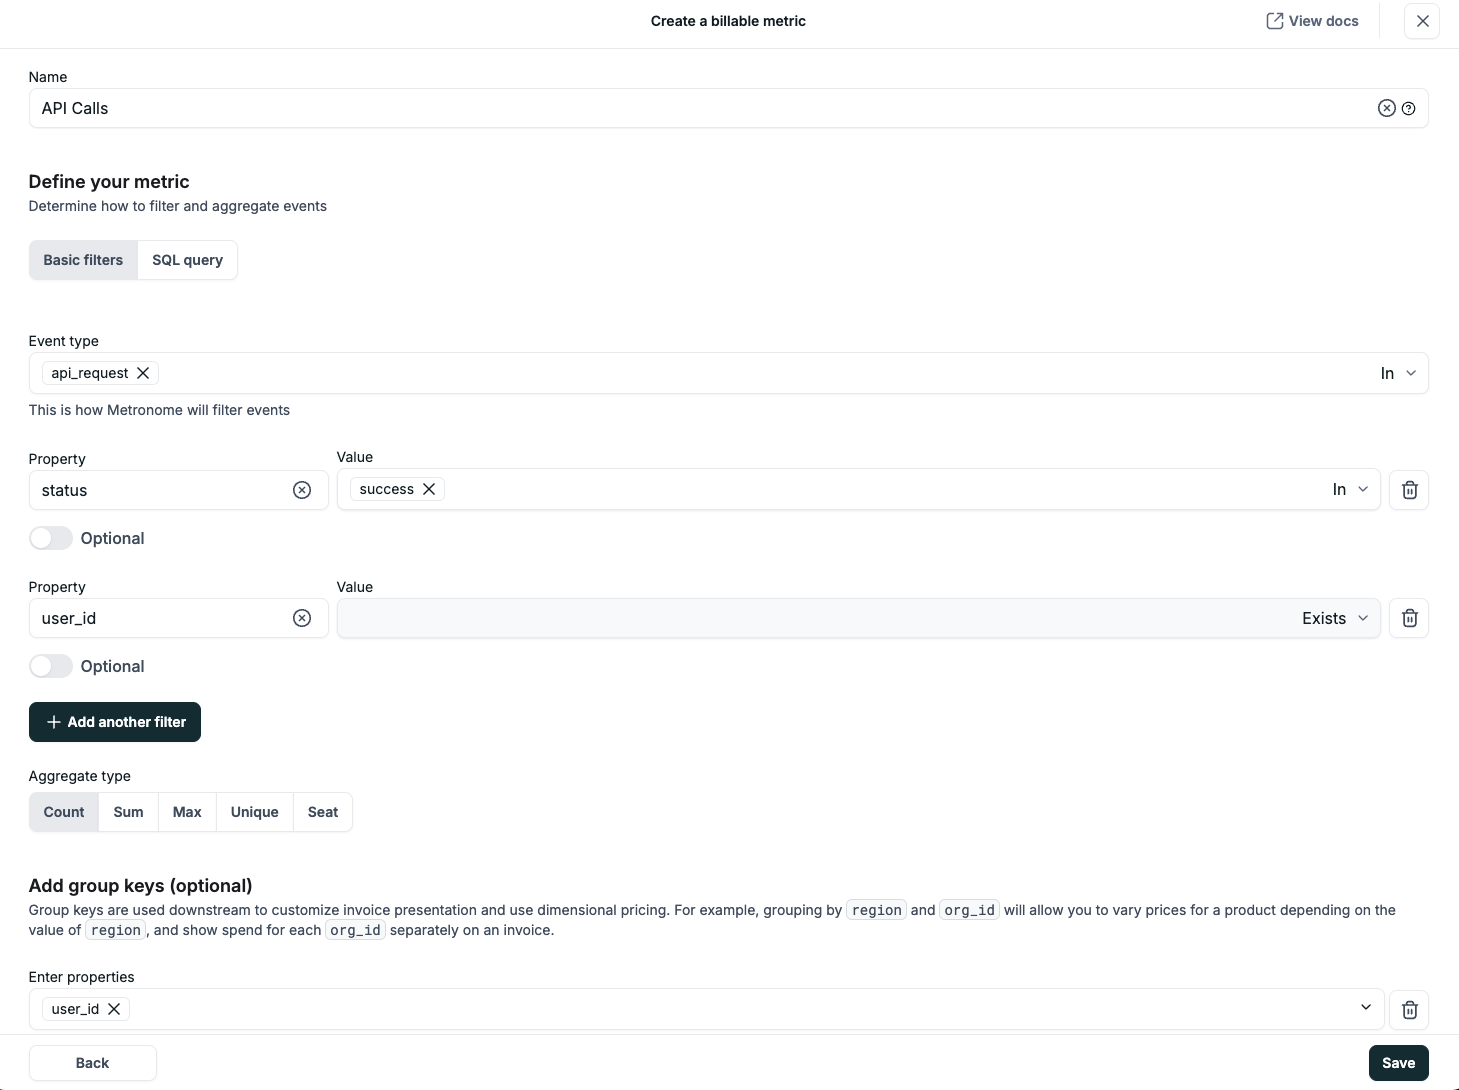 This billable metric counts all successful API calls broken out by `user_id`, providing a simple but effective measure of platform usage across an organization.
Prefer using the API? Here is an example request to set up the same metric:
```bash theme={null}
curl -X POST https://api.metronome.com/v1/billable-metrics/create \
-H "Authorization: Bearer " \
-H "Content-Type: application/json" \
-d '{
"name":"API Calls",
"event_type_filter": {
"in_values": ["api_request"]
},
"property_filters": [
{
"name": "status",
"exists": true,
"in_values": ["success"]
},
{
"name": "user_id",
"exists": true
}
],
"aggregation_type": "COUNT",
"group_keys": [["user_id"]]
}'
```
This billable metric counts all successful API calls broken out by `user_id`, providing a simple but effective measure of platform usage across an organization.
Prefer using the API? Here is an example request to set up the same metric:
```bash theme={null}
curl -X POST https://api.metronome.com/v1/billable-metrics/create \
-H "Authorization: Bearer " \
-H "Content-Type: application/json" \
-d '{
"name":"API Calls",
"event_type_filter": {
"in_values": ["api_request"]
},
"property_filters": [
{
"name": "status",
"exists": true,
"in_values": ["success"]
},
{
"name": "user_id",
"exists": true
}
],
"aggregation_type": "COUNT",
"group_keys": [["user_id"]]
}'
```