> ## Documentation Index
> Fetch the complete documentation index at: https://docs.metronome.com/llms.txt
> Use this file to discover all available pages before exploring further.
# Build API-powered customer dashboards
This use case walks through examples for how to build an API-powered customer dashboard.
Metronome integrates with your core product by providing cost visibility to end customers. This helps them optimize usage patterns and derive maximum value from your product. With your usage-based offerings, customers expect transparency into their consumption and associated costs. Metronome's APIs and data export features integrate with your product, enabling you to create end-user dashboards that provide this critical visibility.
## Show customers data they want to see
Customer dashboards provide essential insights into resource consumption and cost management: a critical customer interface with your product. Customers want to understand their usage patterns so they can make informed decisions around their usage and build trust that they're getting metered accurately.
Excellent customer dashboards that delight customers often share similar characteristics:
* **Granular usage visibility** Customers want to decompose their usage by product or feature to better understand their biggest cost centers and reallocate usage when needed.
* **Up-to-date spend visibility** Customers want to see how much in spend they’ve already accumulated for their current billing period before getting charged, preventing surprises at the end of the billing period.
* **Commitment tracking** Customers want to know the available balance for their current commits to plan their usage and proactively purchase new commits.
* **Build trust** Customers expect high precision in metering their usage. Providing transparency into the rating process in real time builds confidence that this expectation is met.
You can accomplish all of the above outcomes for your customer dashboards by building directly off of the Metronome API. Metronome also provides out-of-the-box embeddable dashboards that show a customer's usage and invoices.
## Use Metronome APIs to power customer-facing dashboards
Metronome offers several API endpoints that provide data useful for powering dashboards that your customers want to see. This section explores a few of these endpoints.
For assistance in designing your customer dashboard with Metronome APIs, contact your Metronome representative.
### Backend integration pattern best practice
When integrating Metronome data into your application to expose to your end users, you must ensure that all Metronome APIs get called from one of your backend services to return data to your frontend application. Implement all authentication against Metronome using a securely stored [token](/api-reference/authorization) available to your backend service. Never expose Metronome API tokens to users or use them on frontend clients.
```
Your Frontend App <--> Your Backend Service <--> Metronome APIs
```
### Display granular usage visibility
One way to enhance your customer's experience is to provide them with visibility of their usage in real-time. Metronome can slice and filter this usage based on any of your event properties, enabling highly granular analysis. This transparency enables them to derive insights into their usage patterns, previously unknown to them, and take action. For example, by viewing their usage mid-month, a customer might realize that certain servers they spun up consume a disproportionately greater amount of memory than in previous months. This insight enables them to assess their own internal processes and identify potential optimizations.
To explore how you can create this, consider the following example: create a bar chart that filters down to usage of a particular metric over time.
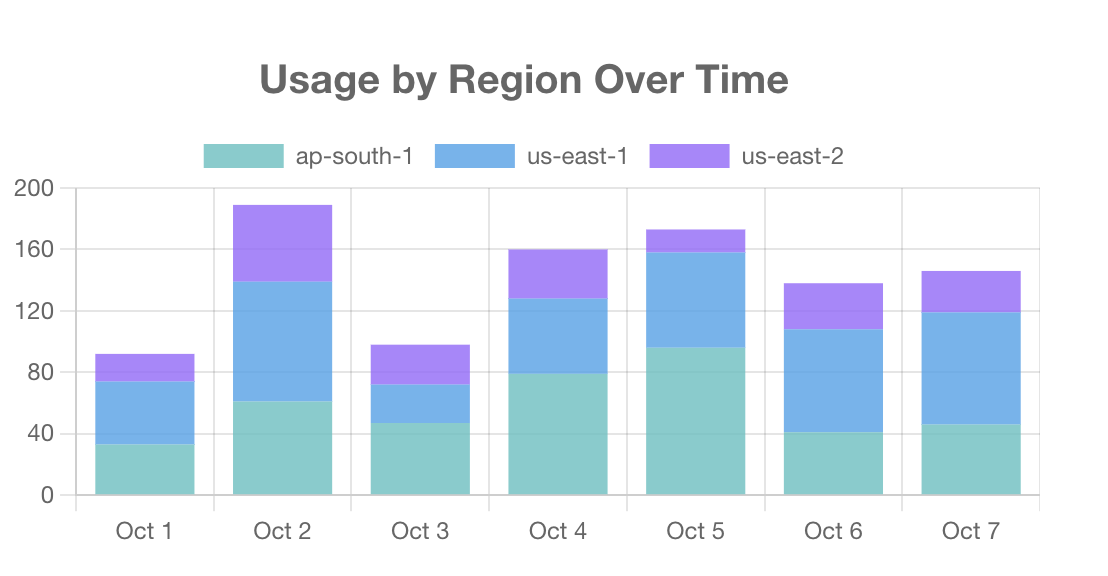 The Metronome [usage endpoint](/api-reference/usage/get-batched-usage-data) provides the foundation for showing users visibility into usage from each of their billable metrics over time.
For example, this request shows daily usage from the `CPU hours` billable metric over the month of October 2024, broken out by region:
```bash theme={null}
curl https://api.metronome.com/v1/usage \
-H "Authorization: Bearer " \
-H "Content-Type: application/json" \
-d '{
"customer_id": "140a7113-76c4-4ce2-9379-29fa3375d23c",
"billable_metric_id": "f3b17844-a98d-413a-b310-5be1df72213d",
"starting_on": "2024-10-01T00:00:00Z",
"ending_before": "2024-11-01T00:00:00Z",
"window_size": "day",
"group_by": {
"key": "region"
}
}'
```
An example response to this request looks like:
```json theme={null}
{
"data": [
{
"value": 37,
"group_key": "region",
"group_value": "ap-south-1",
"starting_on": "2024-10-01T00:00:00+00:00",
"ending_before": "2024-10-02T00:00:00+00:00"
},
{
"value": 24,
"group_key": "region",
"group_value": "us-east-1",
"starting_on": "2024-10-01T00:00:00+00:00",
"ending_before": "2024-10-02T00:00:00+00:00"
},
{
"value": 12,
"group_key": "region",
"group_value": "us-east-2",
"starting_on": "2024-10-01T00:00:00+00:00",
"ending_before": "2024-10-02T00:00:00+00:00"
},
{
"value": 91,
"group_key": "region",
"group_value": "ap-south-1",
"starting_on": "2024-10-02T00:00:00+00:00",
"ending_before": "2024-10-03T00:00:00+00:00"
}
],
"next_page": null
}
```
Use this pseudocode to pull together data from the Metronome usage endpoint in your backend and present it to users as a stacked bar chart in your frontend.
```python Backend theme={null}
# Step 1: Extract the data from the API response
data = metronome_api_response['data']
# Step 2: Create a dictionary to store the processed data
processed_data = {}
# Step 3: Iterate through the data and organize it by date and region
for item in data:
date = item['starting_on']
region = item['group_value']
value = item['value']
if date not in processed_data:
processed_data[date] = {}
processed_data[date][region] = value
# Step 4: Create a list of unique regions and sort them
regions = sorted(set(item['group_value'] for item in data))
# Step 5: Prepare the data for charting
chart_data = []
for date in sorted(processed_data.keys()):
data_point = {'date': date}
cumulative_value = 0
for region in regions:
value = processed_data[date].get(region, 0)
data_point[f"{region}_start"] = cumulative_value
cumulative_value += value
data_point[f"{region}_end"] = cumulative_value
chart_data.append(data_point)
# Return chart data for frontend chart library usage
return chart_data
```
```javascript Frontend theme={null}
# Step 1: Fetch billable metric chart data from your backend (from above)
chart_data = fetch_from_backend('/api/customer_usage/:customer_id')
# Step 2: Use the chart_data to create your stacked bar chart
# The exact implementation depends on your charting library
# Example using a hypothetical charting library:
create_stacked_bar_chart(
data=chart_data,
x_axis='date',
y_axis='value',
stacks=regions,
colors=['blue', 'red', 'green'], # Assign colors to each region
title='Usage by Region Over Time'
)
```
### Display commitment tracking
Inside of Metronome, you can view a ledger of each commit and credit. This offers visibility into current balance and the events that contributed to it. You can imagine that your end customers would also benefit from this visibility to understand their remaining balance on a specific credit or commit. This can help inform their decision-making, such as purchasing a new commit or throttling their usage to stay within their remaining allotment.
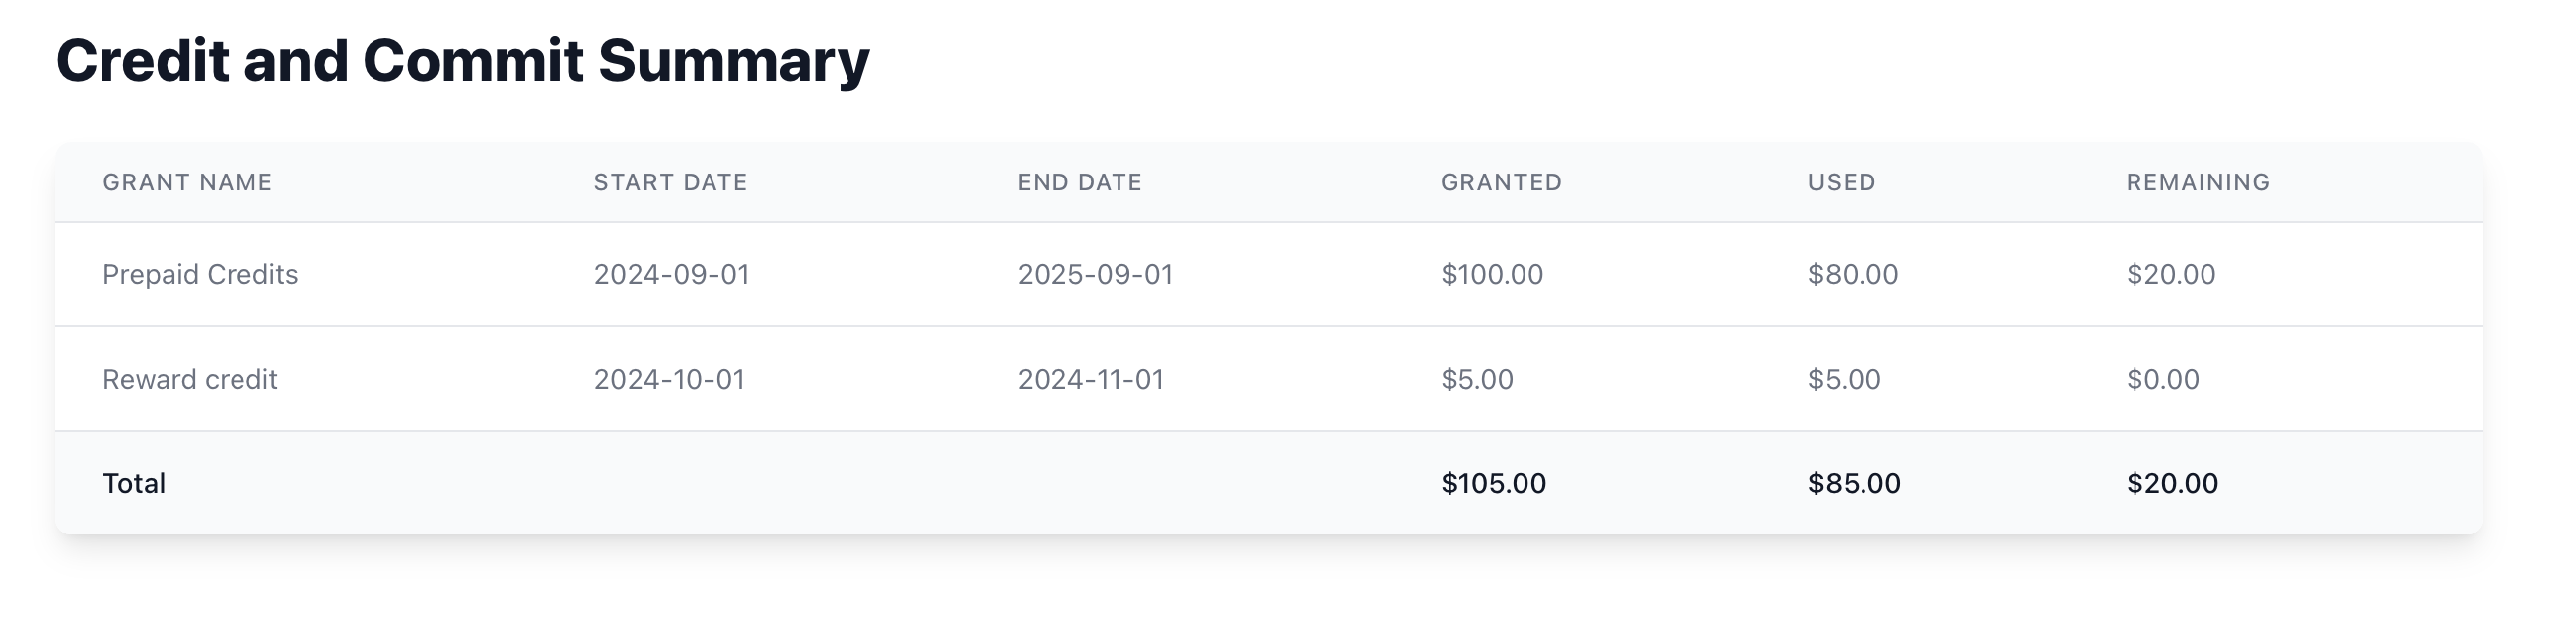
This example table shows how you could display this information to your customer:
The Metronome [usage endpoint](/api-reference/usage/get-batched-usage-data) provides the foundation for showing users visibility into usage from each of their billable metrics over time.
For example, this request shows daily usage from the `CPU hours` billable metric over the month of October 2024, broken out by region:
```bash theme={null}
curl https://api.metronome.com/v1/usage \
-H "Authorization: Bearer " \
-H "Content-Type: application/json" \
-d '{
"customer_id": "140a7113-76c4-4ce2-9379-29fa3375d23c",
"billable_metric_id": "f3b17844-a98d-413a-b310-5be1df72213d",
"starting_on": "2024-10-01T00:00:00Z",
"ending_before": "2024-11-01T00:00:00Z",
"window_size": "day",
"group_by": {
"key": "region"
}
}'
```
An example response to this request looks like:
```json theme={null}
{
"data": [
{
"value": 37,
"group_key": "region",
"group_value": "ap-south-1",
"starting_on": "2024-10-01T00:00:00+00:00",
"ending_before": "2024-10-02T00:00:00+00:00"
},
{
"value": 24,
"group_key": "region",
"group_value": "us-east-1",
"starting_on": "2024-10-01T00:00:00+00:00",
"ending_before": "2024-10-02T00:00:00+00:00"
},
{
"value": 12,
"group_key": "region",
"group_value": "us-east-2",
"starting_on": "2024-10-01T00:00:00+00:00",
"ending_before": "2024-10-02T00:00:00+00:00"
},
{
"value": 91,
"group_key": "region",
"group_value": "ap-south-1",
"starting_on": "2024-10-02T00:00:00+00:00",
"ending_before": "2024-10-03T00:00:00+00:00"
}
],
"next_page": null
}
```
Use this pseudocode to pull together data from the Metronome usage endpoint in your backend and present it to users as a stacked bar chart in your frontend.
```python Backend theme={null}
# Step 1: Extract the data from the API response
data = metronome_api_response['data']
# Step 2: Create a dictionary to store the processed data
processed_data = {}
# Step 3: Iterate through the data and organize it by date and region
for item in data:
date = item['starting_on']
region = item['group_value']
value = item['value']
if date not in processed_data:
processed_data[date] = {}
processed_data[date][region] = value
# Step 4: Create a list of unique regions and sort them
regions = sorted(set(item['group_value'] for item in data))
# Step 5: Prepare the data for charting
chart_data = []
for date in sorted(processed_data.keys()):
data_point = {'date': date}
cumulative_value = 0
for region in regions:
value = processed_data[date].get(region, 0)
data_point[f"{region}_start"] = cumulative_value
cumulative_value += value
data_point[f"{region}_end"] = cumulative_value
chart_data.append(data_point)
# Return chart data for frontend chart library usage
return chart_data
```
```javascript Frontend theme={null}
# Step 1: Fetch billable metric chart data from your backend (from above)
chart_data = fetch_from_backend('/api/customer_usage/:customer_id')
# Step 2: Use the chart_data to create your stacked bar chart
# The exact implementation depends on your charting library
# Example using a hypothetical charting library:
create_stacked_bar_chart(
data=chart_data,
x_axis='date',
y_axis='value',
stacks=regions,
colors=['blue', 'red', 'green'], # Assign colors to each region
title='Usage by Region Over Time'
)
```
### Display commitment tracking
Inside of Metronome, you can view a ledger of each commit and credit. This offers visibility into current balance and the events that contributed to it. You can imagine that your end customers would also benefit from this visibility to understand their remaining balance on a specific credit or commit. This can help inform their decision-making, such as purchasing a new commit or throttling their usage to stay within their remaining allotment.
This example table shows how you could display this information to your customer:
 Use the Metronome [`/listBalances`](/api-reference/credits-and-commits/list-balances) endpoint to understand the current state of a customer's balance across commits and credits.
For example, consider a customer that has:
* Received a prepaid commit of \$100, starting on September 1st, 2024.
* Received a free reward credit for \$5, starting on October 1st, 2024. The free credit should be used in full before the remaining prepaid commit gets burned down.
* Spent \$65 in the month of September.
* Spent \$20 in the month of October.
In this scenario, the customer has the following balances remaining:
* Reward credit: \$0 remaining, \$5 used
* Prepaid commit: \$20 remaining, \$80 used
* Overall balance: \$20 remaining, \$85 used
Use the `/listBalances` endpoint to retrieve information about the prepaid commit and bonus credit from September 1st onward in one response. Because the request includes the `include_balance: true` parameter, for each commit or credit a `balance` field returns that reflects the amount of commit or credit available to use now. Note that any upcoming, not-yet-started commit or credit segments are not included in this balance as they are not available to use.
```bash theme={null}
curl -X POST https://api.metronome.com/v1/contracts/customerBalances/list \
-H "Authorization: Bearer " \
-H "Content-Type: application/json" \
-d '{
"customer_id": "23f894af-c350-45df-bb3e-3b134e352109",
"include_ledgers": true,
"include_balance": true,
"starting_at": "2024-09-01T00:00:00Z",
"include_contract_balances": true
}'
```
```json theme={null}
{
"data": [
{
"id": "b8bc055d-2c0f-4629-b9e4-c87e0b59da1e",
"contract": {
"id": "8b6cb03d-c9c7-4230-9656-ed8e106bc7bd"
},
"product": {
"id": "d72716a4-1dcc-4e91-8ad4-a1be29c917a7",
"name": "Prepaid Credits"
},
"priority": 100,
"applicable_contract_ids": ["8b6cb03d-c9c7-4230-9656-ed8e106bc7bd"],
"access_schedule": {
"credit_type": {
"id": "2714e483-4ff1-48e4-9e25-ac732e8f24f2",
"name": "USD (cents)"
},
"schedule_items": [
{
"id": "e20d07a1-63c0-4fef-ac23-50f7b710cf3e",
"amount": 10000,
"starting_at": "2024-09-01T00:00:00+00:00",
"ending_before": "2025-09-01T00:00:00+00:00"
}
]
},
"balance": 2000,
"ledger": [
{
"amount": 10000,
"timestamp": "2024-09-01T00:00:00+00:00",
"segment_id": "e20d07a1-63c0-4fef-ac23-50f7b710cf3e",
"type": "PREPAID_COMMIT_SEGMENT_START"
},
{
"amount": -6500,
"timestamp": "2024-10-01T00:00:00+00:00",
"segment_id": "e20d07a1-63c0-4fef-ac23-50f7b710cf3e",
"type": "PREPAID_COMMIT_AUTOMATED_INVOICE_DEDUCTION",
"invoice_id": "3f13f349-c1a6-5e98-81ce-fd3743904e6f"
},
{
"amount": -1500,
"timestamp": "2024-11-01T00:00:00+00:00",
"segment_id": "e20d07a1-63c0-4fef-ac23-50f7b710cf3e",
"type": "PREPAID_COMMIT_AUTOMATED_INVOICE_DEDUCTION",
"invoice_id": "832ed401-17ed-56dd-87c4-b5684a52b26c"
}
],
"custom_fields": {},
"type": "PREPAID",
"invoice_schedule": {
"credit_type": {
"id": "2714e483-4ff1-48e4-9e25-ac732e8f24f2",
"name": "USD (cents)"
},
"schedule_items": [
{
"id": "a528d105-4a7c-4a93-b630-56ccf8a675d5",
"invoice_id": "0267436e-3c4d-5ee4-9369-5618f27229a5",
"amount": 10000,
"unit_price": 10000,
"quantity": 1,
"timestamp": "2024-09-01T00:00:00+00:00"
}
]
}
},
{
"id": "c0522458-353f-4a39-bad2-a315ff2eed88",
"contract": {
"id": "8b6cb03d-c9c7-4230-9656-ed8e106bc7bd"
},
"product": {
"id": "aa52ce3b-f896-4f5c-b1ec-a71dff8ebfeb",
"name": "Reward credit"
},
"priority": 1,
"applicable_contract_ids": ["8b6cb03d-c9c7-4230-9656-ed8e106bc7bd"],
"access_schedule": {
"credit_type": {
"id": "2714e483-4ff1-48e4-9e25-ac732e8f24f2",
"name": "USD (cents)"
},
"schedule_items": [
{
"id": "3b4be61d-26d0-46a5-acb5-c55d5cce0d9c",
"amount": 500,
"starting_at": "2024-10-01T00:00:00+00:00",
"ending_before": "2024-11-01T00:00:00+00:00"
}
]
},
"balance": 0,
"ledger": [
{
"amount": 500,
"timestamp": "2024-10-01T00:00:00+00:00",
"segment_id": "3b4be61d-26d0-46a5-acb5-c55d5cce0d9c",
"type": "CREDIT_SEGMENT_START"
},
{
"amount": -500,
"timestamp": "2024-11-01T00:00:00+00:00",
"segment_id": "3b4be61d-26d0-46a5-acb5-c55d5cce0d9c",
"type": "CREDIT_AUTOMATED_INVOICE_DEDUCTION",
"invoice_id": "832ed401-17ed-56dd-87c4-b5684a52b26c"
}
],
"custom_fields": {},
"type": "CREDIT"
}
],
"next_page": null
}
```
Use this pseudocode to pull together the data from the Metronome `/listBalances` endpoint in your backend and present it to end users as a stacked bar chart in your frontend.
```python Backend theme={null}
# Step 1: Extract the data from the Metronome API response
data = metronome_api_response['data']
# Step 2: Initialize variables for overall totals
total_granted = 0
total_used = 0
# Step 3: Process each grant
processed_grants = []
for item in data:
grant_id = item['id']
grant_type = item['type']
product_name = item['product']['name']
# Calculate total granted for this item
granted = sum(schedule_item['amount'] for schedule_item in item['access_schedule']['schedule_items'])
# Get remaining amount
remaining = item['balance']
# Calculate used amount
used = granted - remaining
# Add to overall totals
total_granted += granted
total_used += used
# Add grant info to list
processed_grants.append({
'id': grant_id,
'type': grant_type,
'product_name': product_name,
'granted': granted,
'used': used,
'remaining': remaining
})
# Step 4: Calculate total remaining
total_remaining = total_granted - total_used
# Step 5: Prepare result
result = {
'grants': processed_grants,
'total': {
'granted': total_granted,
'used': total_used,
'remaining': total_remaining
}
}
# Step 6: Return processed data for frontend use
return result
```
```javascript Frontend theme={null}
# Step 1: Fetch processed credit and commit data from backend
processed_data = fetch_from_backend('/api/credit_commit_data/:customer_id')
# Step 2: Display individual grants
for grant in processed_data['grants']:
display_grant_info(grant)
# Step 3: Display overall totals
display_overall_totals(processed_data['total'])
```
Additionally, you may want to show a running total of the remaining balance to your customer on a general overview page, without the ledger detail. Metronome offers an ergonomic way to pull a total remaining balance in these scenarios.
For example, you may have heard feedback that customers want to understand their remaining balance on the home page of your app, without needing to click into the detailed billing view to understand their detailed commit and credit drawdowns. In this case you can make a straightforward call to the [`/getNetBalance`](https://docs.metronome.com/api-reference/credits-and-commits/get-the-net-balance-of-a-customer) endpoint. The following call would return the real-time balance without needing to parse through individual balance details.
```bash theme={null}
curl -X POST https://api.metronome.com/v1/contracts/customerBalances/getNetBalance \
-H "Authorization: Bearer " \
-H "Content-Type: application/json" \
-d '{
"customer_id": "23f894af-c350-45df-bb3e-3b134e352109"
}'
```
### Display up-to-date spend
While the usage dashboard helps derive granular insights into usage patterns, often times this isn't the full story. Your customers also want to understand the associated costs of their usage. This helps them contextualize their analysis by understanding the potential cost savings associated with potential process or architectural changes. Additionally, it eliminates the potential of a surprise at the end of the month when they receive their invoice, which can mitigate the risk of potential disputes.
To articulate a customer's cost, create a dashboard inside of your product that shows spend over time, segmented by certain properties. For example, spend by region over time:
Use the Metronome [`/listBalances`](/api-reference/credits-and-commits/list-balances) endpoint to understand the current state of a customer's balance across commits and credits.
For example, consider a customer that has:
* Received a prepaid commit of \$100, starting on September 1st, 2024.
* Received a free reward credit for \$5, starting on October 1st, 2024. The free credit should be used in full before the remaining prepaid commit gets burned down.
* Spent \$65 in the month of September.
* Spent \$20 in the month of October.
In this scenario, the customer has the following balances remaining:
* Reward credit: \$0 remaining, \$5 used
* Prepaid commit: \$20 remaining, \$80 used
* Overall balance: \$20 remaining, \$85 used
Use the `/listBalances` endpoint to retrieve information about the prepaid commit and bonus credit from September 1st onward in one response. Because the request includes the `include_balance: true` parameter, for each commit or credit a `balance` field returns that reflects the amount of commit or credit available to use now. Note that any upcoming, not-yet-started commit or credit segments are not included in this balance as they are not available to use.
```bash theme={null}
curl -X POST https://api.metronome.com/v1/contracts/customerBalances/list \
-H "Authorization: Bearer " \
-H "Content-Type: application/json" \
-d '{
"customer_id": "23f894af-c350-45df-bb3e-3b134e352109",
"include_ledgers": true,
"include_balance": true,
"starting_at": "2024-09-01T00:00:00Z",
"include_contract_balances": true
}'
```
```json theme={null}
{
"data": [
{
"id": "b8bc055d-2c0f-4629-b9e4-c87e0b59da1e",
"contract": {
"id": "8b6cb03d-c9c7-4230-9656-ed8e106bc7bd"
},
"product": {
"id": "d72716a4-1dcc-4e91-8ad4-a1be29c917a7",
"name": "Prepaid Credits"
},
"priority": 100,
"applicable_contract_ids": ["8b6cb03d-c9c7-4230-9656-ed8e106bc7bd"],
"access_schedule": {
"credit_type": {
"id": "2714e483-4ff1-48e4-9e25-ac732e8f24f2",
"name": "USD (cents)"
},
"schedule_items": [
{
"id": "e20d07a1-63c0-4fef-ac23-50f7b710cf3e",
"amount": 10000,
"starting_at": "2024-09-01T00:00:00+00:00",
"ending_before": "2025-09-01T00:00:00+00:00"
}
]
},
"balance": 2000,
"ledger": [
{
"amount": 10000,
"timestamp": "2024-09-01T00:00:00+00:00",
"segment_id": "e20d07a1-63c0-4fef-ac23-50f7b710cf3e",
"type": "PREPAID_COMMIT_SEGMENT_START"
},
{
"amount": -6500,
"timestamp": "2024-10-01T00:00:00+00:00",
"segment_id": "e20d07a1-63c0-4fef-ac23-50f7b710cf3e",
"type": "PREPAID_COMMIT_AUTOMATED_INVOICE_DEDUCTION",
"invoice_id": "3f13f349-c1a6-5e98-81ce-fd3743904e6f"
},
{
"amount": -1500,
"timestamp": "2024-11-01T00:00:00+00:00",
"segment_id": "e20d07a1-63c0-4fef-ac23-50f7b710cf3e",
"type": "PREPAID_COMMIT_AUTOMATED_INVOICE_DEDUCTION",
"invoice_id": "832ed401-17ed-56dd-87c4-b5684a52b26c"
}
],
"custom_fields": {},
"type": "PREPAID",
"invoice_schedule": {
"credit_type": {
"id": "2714e483-4ff1-48e4-9e25-ac732e8f24f2",
"name": "USD (cents)"
},
"schedule_items": [
{
"id": "a528d105-4a7c-4a93-b630-56ccf8a675d5",
"invoice_id": "0267436e-3c4d-5ee4-9369-5618f27229a5",
"amount": 10000,
"unit_price": 10000,
"quantity": 1,
"timestamp": "2024-09-01T00:00:00+00:00"
}
]
}
},
{
"id": "c0522458-353f-4a39-bad2-a315ff2eed88",
"contract": {
"id": "8b6cb03d-c9c7-4230-9656-ed8e106bc7bd"
},
"product": {
"id": "aa52ce3b-f896-4f5c-b1ec-a71dff8ebfeb",
"name": "Reward credit"
},
"priority": 1,
"applicable_contract_ids": ["8b6cb03d-c9c7-4230-9656-ed8e106bc7bd"],
"access_schedule": {
"credit_type": {
"id": "2714e483-4ff1-48e4-9e25-ac732e8f24f2",
"name": "USD (cents)"
},
"schedule_items": [
{
"id": "3b4be61d-26d0-46a5-acb5-c55d5cce0d9c",
"amount": 500,
"starting_at": "2024-10-01T00:00:00+00:00",
"ending_before": "2024-11-01T00:00:00+00:00"
}
]
},
"balance": 0,
"ledger": [
{
"amount": 500,
"timestamp": "2024-10-01T00:00:00+00:00",
"segment_id": "3b4be61d-26d0-46a5-acb5-c55d5cce0d9c",
"type": "CREDIT_SEGMENT_START"
},
{
"amount": -500,
"timestamp": "2024-11-01T00:00:00+00:00",
"segment_id": "3b4be61d-26d0-46a5-acb5-c55d5cce0d9c",
"type": "CREDIT_AUTOMATED_INVOICE_DEDUCTION",
"invoice_id": "832ed401-17ed-56dd-87c4-b5684a52b26c"
}
],
"custom_fields": {},
"type": "CREDIT"
}
],
"next_page": null
}
```
Use this pseudocode to pull together the data from the Metronome `/listBalances` endpoint in your backend and present it to end users as a stacked bar chart in your frontend.
```python Backend theme={null}
# Step 1: Extract the data from the Metronome API response
data = metronome_api_response['data']
# Step 2: Initialize variables for overall totals
total_granted = 0
total_used = 0
# Step 3: Process each grant
processed_grants = []
for item in data:
grant_id = item['id']
grant_type = item['type']
product_name = item['product']['name']
# Calculate total granted for this item
granted = sum(schedule_item['amount'] for schedule_item in item['access_schedule']['schedule_items'])
# Get remaining amount
remaining = item['balance']
# Calculate used amount
used = granted - remaining
# Add to overall totals
total_granted += granted
total_used += used
# Add grant info to list
processed_grants.append({
'id': grant_id,
'type': grant_type,
'product_name': product_name,
'granted': granted,
'used': used,
'remaining': remaining
})
# Step 4: Calculate total remaining
total_remaining = total_granted - total_used
# Step 5: Prepare result
result = {
'grants': processed_grants,
'total': {
'granted': total_granted,
'used': total_used,
'remaining': total_remaining
}
}
# Step 6: Return processed data for frontend use
return result
```
```javascript Frontend theme={null}
# Step 1: Fetch processed credit and commit data from backend
processed_data = fetch_from_backend('/api/credit_commit_data/:customer_id')
# Step 2: Display individual grants
for grant in processed_data['grants']:
display_grant_info(grant)
# Step 3: Display overall totals
display_overall_totals(processed_data['total'])
```
Additionally, you may want to show a running total of the remaining balance to your customer on a general overview page, without the ledger detail. Metronome offers an ergonomic way to pull a total remaining balance in these scenarios.
For example, you may have heard feedback that customers want to understand their remaining balance on the home page of your app, without needing to click into the detailed billing view to understand their detailed commit and credit drawdowns. In this case you can make a straightforward call to the [`/getNetBalance`](https://docs.metronome.com/api-reference/credits-and-commits/get-the-net-balance-of-a-customer) endpoint. The following call would return the real-time balance without needing to parse through individual balance details.
```bash theme={null}
curl -X POST https://api.metronome.com/v1/contracts/customerBalances/getNetBalance \
-H "Authorization: Bearer " \
-H "Content-Type: application/json" \
-d '{
"customer_id": "23f894af-c350-45df-bb3e-3b134e352109"
}'
```
### Display up-to-date spend
While the usage dashboard helps derive granular insights into usage patterns, often times this isn't the full story. Your customers also want to understand the associated costs of their usage. This helps them contextualize their analysis by understanding the potential cost savings associated with potential process or architectural changes. Additionally, it eliminates the potential of a surprise at the end of the month when they receive their invoice, which can mitigate the risk of potential disputes.
To articulate a customer's cost, create a dashboard inside of your product that shows spend over time, segmented by certain properties. For example, spend by region over time:
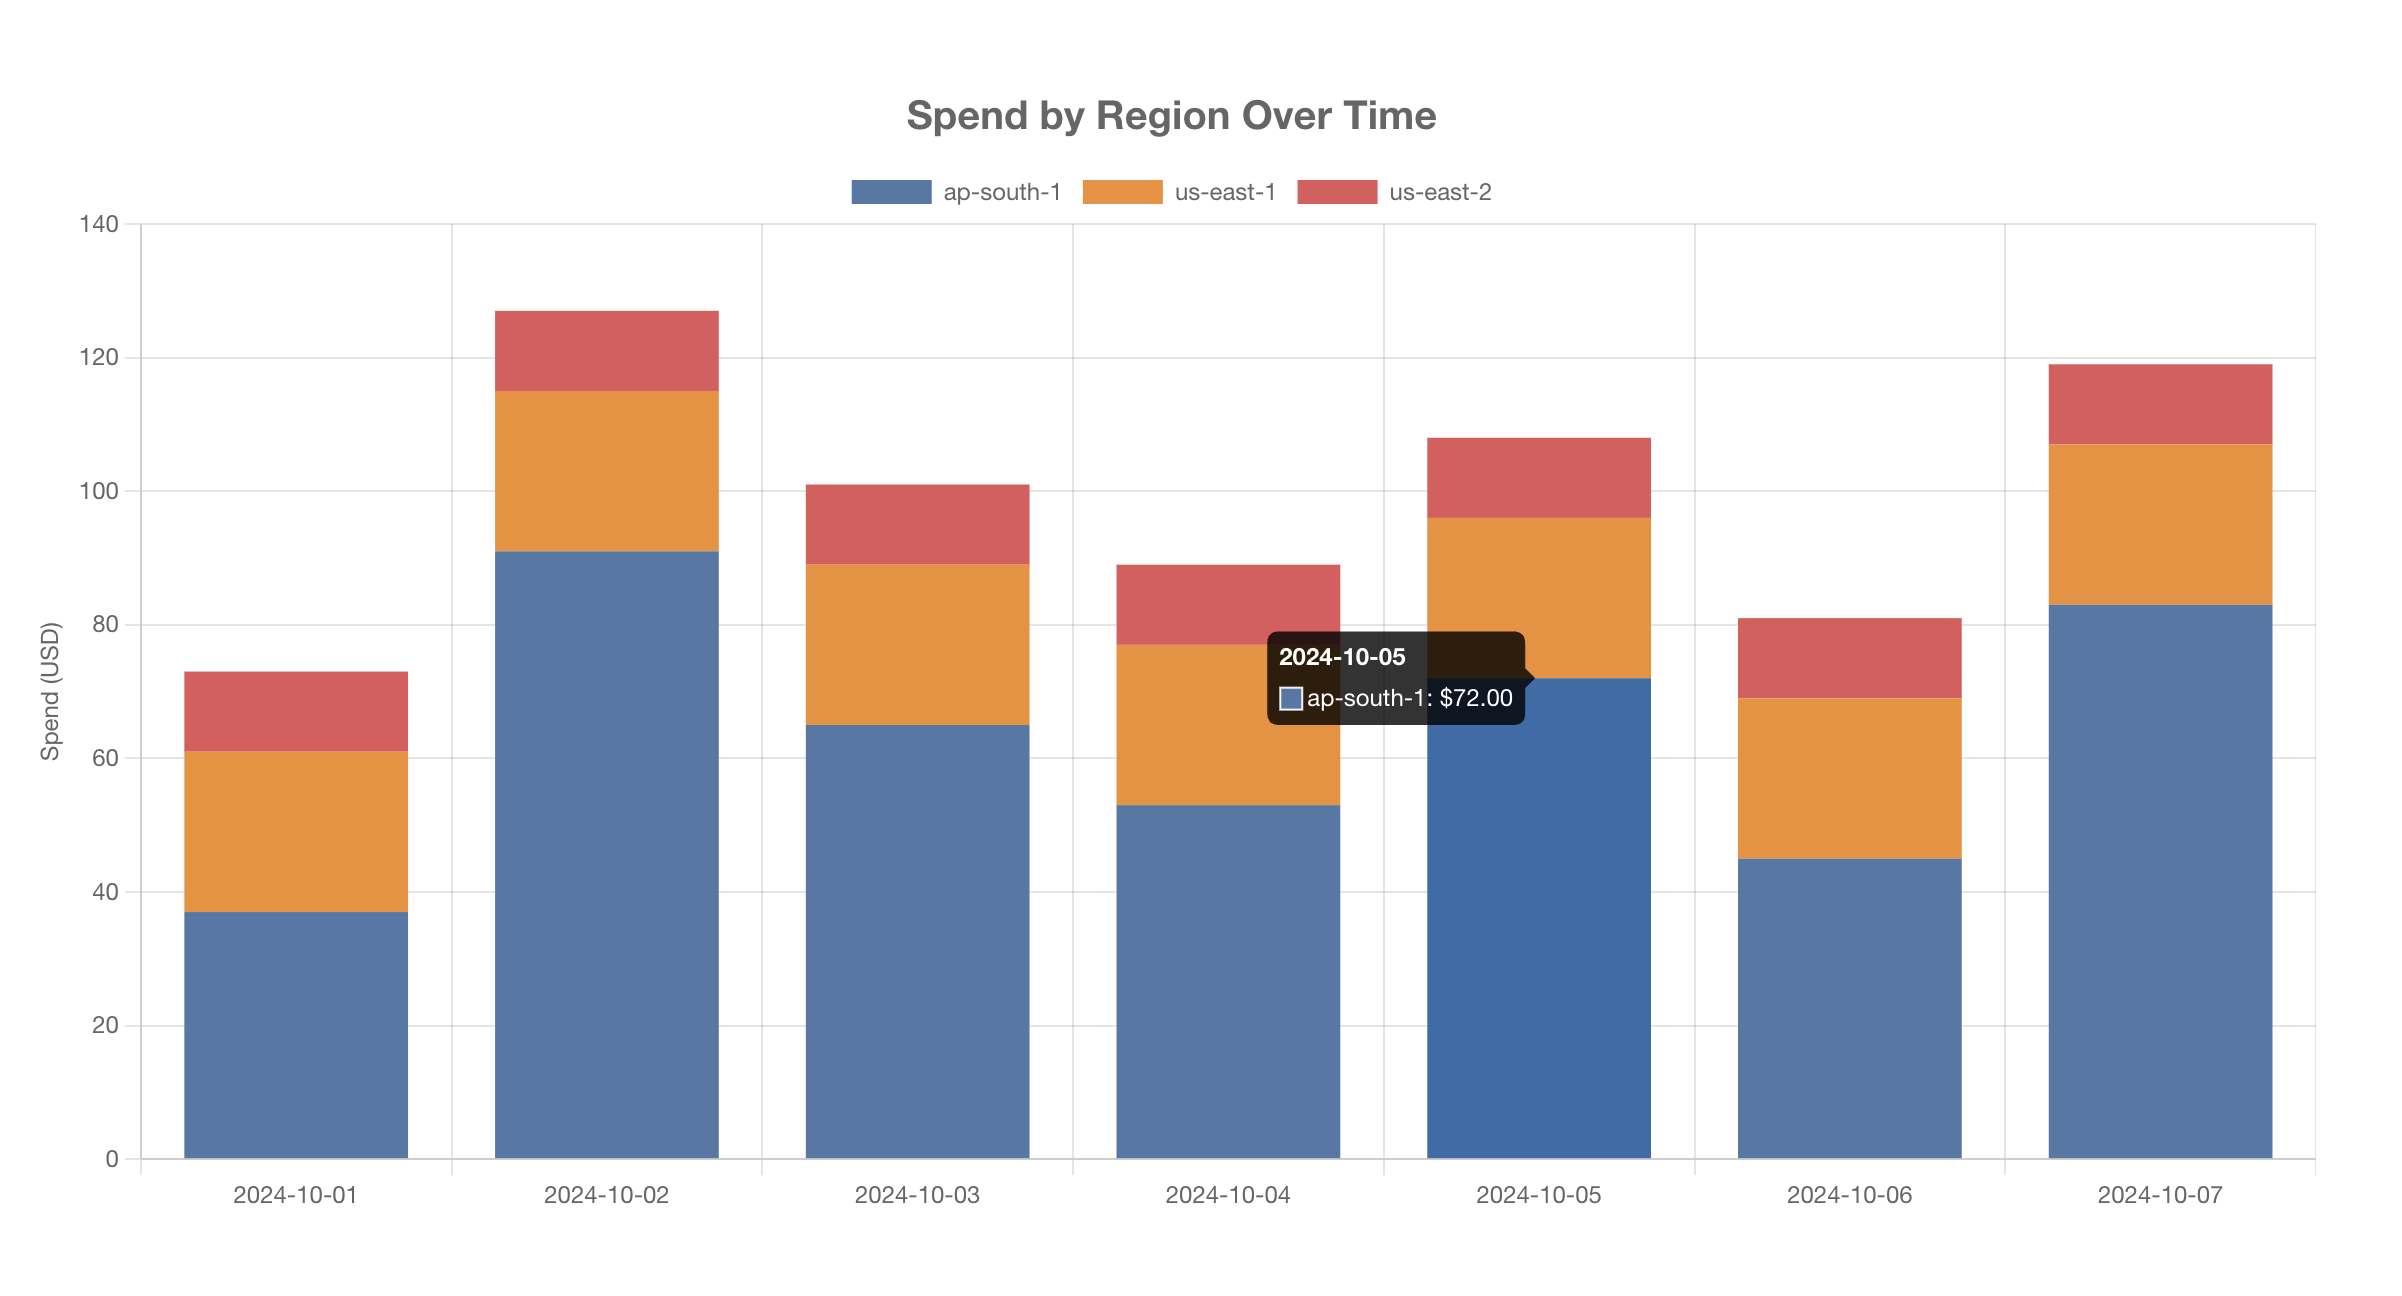 Use the Metronome [invoice breakdown endpoint](/api-reference/invoices/list-invoice-breakdowns) to view spend over a given time window. The invoice breakdown endpoint gets returned for each line item on a customer's invoice in hourly or daily buckets.
If commits or credits get consumed against certain line items during the period, they display as separate line items to mark the deductions for the amount of credits used.
For example, this request generates a customer's daily spend across all line items for the month of October 2024. In this example a customer doesn't burn against any set of credits or commits and only pays in arrears.
```bash theme={null}
curl https://api.metronome.com/v1/customers/d7abd0cd-4ae9-4db7-8676-e986a4ebd8dc/invoices/breakdowns?starting_on=2024-10-01T00%3A00%3A00Z&ending_before=2024-11-01T00%3A00%3A00Z&window_size=day \
-H "Authorization: Bearer " \
-H "Content-Type: application/json"
```
```json theme={null}
{
"data": [
{
"id": "c5b9aab9-377b-517d-a634-924e35e7d110",
"issued_at": "2024-11-02T00:00:00+00:00",
"start_timestamp": "2024-10-01T00:00:00+00:00",
"end_timestamp": "2024-11-01T00:00:00+00:00",
"customer_id": "140a7113-76c4-4ce2-9379-29fa3375d23c",
"customer_custom_fields": {},
"type": "USAGE",
"credit_type": {
"id": "2714e483-4ff1-48e4-9e25-ac732e8f24f2",
"name": "USD (cents)"
},
"status": "DRAFT",
"total": 7300,
"external_invoice": null,
"contract_id": "28d9bc16-7c56-4d4a-a2b9-b4c3ede34eeb",
"contract_custom_fields": {},
"line_items": [
{
"product_id": "d111fa1e-861e-48bb-82a6-3924d6cf0636",
"product_type": "UsageProductListItem",
"product_custom_fields": {},
"name": "My Product",
"total": 3700,
"credit_type": {
"id": "2714e483-4ff1-48e4-9e25-ac732e8f24f2",
"name": "USD (cents)"
},
"starting_at": "2024-10-01T00:00:00+00:00",
"ending_before": "2024-11-01T00:00:00+00:00",
"unit_price": 100,
"quantity": 37,
"presentation_group_values": {
"region": "ap-south-1"
}
},
{
"product_id": "d111fa1e-861e-48bb-82a6-3924d6cf0636",
"product_type": "UsageProductListItem",
"product_custom_fields": {},
"name": "My Product",
"total": 2400,
"credit_type": {
"id": "2714e483-4ff1-48e4-9e25-ac732e8f24f2",
"name": "USD (cents)"
},
"starting_at": "2024-10-01T00:00:00+00:00",
"ending_before": "2024-11-01T00:00:00+00:00",
"unit_price": 100,
"quantity": 24,
"presentation_group_values": {
"region": "us-east-1"
}
},
{
"product_id": "d111fa1e-861e-48bb-82a6-3924d6cf0636",
"product_type": "UsageProductListItem",
"product_custom_fields": {},
"name": "My Product",
"total": 1200,
"credit_type": {
"id": "2714e483-4ff1-48e4-9e25-ac732e8f24f2",
"name": "USD (cents)"
},
"starting_at": "2024-10-01T00:00:00+00:00",
"ending_before": "2024-11-01T00:00:00+00:00",
"unit_price": 100,
"quantity": 12,
"presentation_group_values": {
"region": "us-east-2"
}
}
],
"custom_fields": {},
"billable_status": "billable",
"breakdown_start_timestamp": "2024-10-01T00:00:00.000Z",
"breakdown_end_timestamp": "2024-10-02T00:00:00.000Z"
}
],
"next_page": null
}
```
If you update the scenario above to show the customer burning down against a \$200 prepaid commit, you see the commit deductions represented in the breakdown in addition to the usage line items. Use these fields if you want to show credit and commit burndown over time.
```json theme={null}
{
"data": [
{
"id": "5d960878-2553-5290-bddd-8def5f42532a",
"issued_at": "2024-11-02T00:00:00+00:00",
"start_timestamp": "2024-10-01T00:00:00+00:00",
"end_timestamp": "2024-11-01T00:00:00+00:00",
"customer_id": "140a7113-76c4-4ce2-9379-29fa3375d23c",
"customer_custom_fields": {},
"type": "USAGE",
"credit_type": {
"id": "2714e483-4ff1-48e4-9e25-ac732e8f24f2",
"name": "USD (cents)"
},
"status": "DRAFT",
"total": 0,
"external_invoice": null,
"contract_id": "95a390e3-b5c6-4264-8c7a-3583ec574c42",
"contract_custom_fields": {},
"line_items": [
{
"product_id": "d111fa1e-861e-48bb-82a6-3924d6cf0636",
"product_type": "UsageProductListItem",
"product_custom_fields": {},
"name": "My Product",
"total": 3700,
"credit_type": {
"id": "2714e483-4ff1-48e4-9e25-ac732e8f24f2",
"name": "USD (cents)"
},
"starting_at": "2024-10-01T00:00:00+00:00",
"ending_before": "2024-11-01T00:00:00+00:00",
"commit_id": "f3243ab9-dd22-4a6e-b4c3-7b2a0f8e8732",
"commit_segment_id": "ede54bc6-0c23-4d0b-a096-d6c79f38ff31",
"commit_type": "PrepaidCommit",
"commit_custom_fields": {},
"unit_price": 100,
"quantity": 37,
"presentation_group_values": {
"region": "ap-south-1"
}
},
{
"product_id": "d111fa1e-861e-48bb-82a6-3924d6cf0636",
"product_type": "UsageProductListItem",
"product_custom_fields": {},
"name": "Prepaid Credits applied",
"total": -3700,
"credit_type": {
"id": "2714e483-4ff1-48e4-9e25-ac732e8f24f2",
"name": "USD (cents)"
},
"starting_at": "2024-10-01T00:00:00+00:00",
"ending_before": "2024-11-01T00:00:00+00:00",
"commit_id": "f3243ab9-dd22-4a6e-b4c3-7b2a0f8e8732",
"commit_segment_id": "ede54bc6-0c23-4d0b-a096-d6c79f38ff31",
"commit_type": "PrepaidCommit",
"commit_custom_fields": {}
}
],
"custom_fields": {},
"billable_status": "billable",
"breakdown_start_timestamp": "2024-10-01T00:00:00.000Z",
"breakdown_end_timestamp": "2024-10-02T00:00:00.000Z"
}
],
"next_page": null
}
```
Use this pseudocode to pull together data from the Metronome invoice breakdown endpoint in your backend and present it to users as a stacked bar chart in your frontend.
```python Backend theme={null}
# Step 1: Extract the data from the Metronome API response
data = metronome_api_response['data']
# Step 2: Create a dictionary to store the processed data
processed_data = {}
# Step 3: Iterate through the data and organize it by date and region
for item in data:
date = item['breakdown_start_timestamp']
for line_item in item['line_items']:
region = line_item['presentation_group_values']['region']
value = line_item['total'] / 100 # Convert cents to dollars
if date not in processed_data:
processed_data[date] = {}
if region not in processed_data[date]:
processed_data[date][region] = 0
processed_data[date][region] += value
# Step 4: Create a list of unique regions and sort them
regions = sorted(set(region for date_data in processed_data.values() for region in date_data.keys()))
# Step 5: Prepare the data for charting
chart_data = []
for date in sorted(processed_data.keys()):
data_point = {'date': date}
for region in regions:
data_point[region] = processed_data[date].get(region, 0)
chart_data.append(data_point)
# Return chart data for frontend chart library usage
return chart_data
```
```javascript Frontend theme={null}
# Step 1: Fetch spend over time chart data from your backend
chart_data = fetch_from_backend('/api/customer_spend/:customer_id')
# Step 2: Extract unique regions from the chart data
regions = list(set(key.split('_')[0] for key in chart_data[0].keys() if key.endswith('_start')))
# Step 3: Use the chart_data to create your stacked bar chart
# The exact implementation depends on your charting library
# Example using Chart.js:
create_stacked_bar_chart(
data=chart_data,
x_axis='date',
y_axis='Spend (USD)',
stacks=regions,
colors=['#4e79a7', '#f28e2c', '#e15759'], # Assign colors to each region
title='Spend by Region Over Time'
)
```
## Embeddable dashboards
Share Metronome invoices and usage data with your customers through customizable embeddable dashboards.
### Invoice Dashboard
The invoice dashboard allows your customers to view their current and historical invoices (draft, finalized, and voided), up to 90 days old. For clients using Metronome's invoicing product, your customers can also manually attempt payment on outstanding invoices.
Use the Metronome [invoice breakdown endpoint](/api-reference/invoices/list-invoice-breakdowns) to view spend over a given time window. The invoice breakdown endpoint gets returned for each line item on a customer's invoice in hourly or daily buckets.
If commits or credits get consumed against certain line items during the period, they display as separate line items to mark the deductions for the amount of credits used.
For example, this request generates a customer's daily spend across all line items for the month of October 2024. In this example a customer doesn't burn against any set of credits or commits and only pays in arrears.
```bash theme={null}
curl https://api.metronome.com/v1/customers/d7abd0cd-4ae9-4db7-8676-e986a4ebd8dc/invoices/breakdowns?starting_on=2024-10-01T00%3A00%3A00Z&ending_before=2024-11-01T00%3A00%3A00Z&window_size=day \
-H "Authorization: Bearer " \
-H "Content-Type: application/json"
```
```json theme={null}
{
"data": [
{
"id": "c5b9aab9-377b-517d-a634-924e35e7d110",
"issued_at": "2024-11-02T00:00:00+00:00",
"start_timestamp": "2024-10-01T00:00:00+00:00",
"end_timestamp": "2024-11-01T00:00:00+00:00",
"customer_id": "140a7113-76c4-4ce2-9379-29fa3375d23c",
"customer_custom_fields": {},
"type": "USAGE",
"credit_type": {
"id": "2714e483-4ff1-48e4-9e25-ac732e8f24f2",
"name": "USD (cents)"
},
"status": "DRAFT",
"total": 7300,
"external_invoice": null,
"contract_id": "28d9bc16-7c56-4d4a-a2b9-b4c3ede34eeb",
"contract_custom_fields": {},
"line_items": [
{
"product_id": "d111fa1e-861e-48bb-82a6-3924d6cf0636",
"product_type": "UsageProductListItem",
"product_custom_fields": {},
"name": "My Product",
"total": 3700,
"credit_type": {
"id": "2714e483-4ff1-48e4-9e25-ac732e8f24f2",
"name": "USD (cents)"
},
"starting_at": "2024-10-01T00:00:00+00:00",
"ending_before": "2024-11-01T00:00:00+00:00",
"unit_price": 100,
"quantity": 37,
"presentation_group_values": {
"region": "ap-south-1"
}
},
{
"product_id": "d111fa1e-861e-48bb-82a6-3924d6cf0636",
"product_type": "UsageProductListItem",
"product_custom_fields": {},
"name": "My Product",
"total": 2400,
"credit_type": {
"id": "2714e483-4ff1-48e4-9e25-ac732e8f24f2",
"name": "USD (cents)"
},
"starting_at": "2024-10-01T00:00:00+00:00",
"ending_before": "2024-11-01T00:00:00+00:00",
"unit_price": 100,
"quantity": 24,
"presentation_group_values": {
"region": "us-east-1"
}
},
{
"product_id": "d111fa1e-861e-48bb-82a6-3924d6cf0636",
"product_type": "UsageProductListItem",
"product_custom_fields": {},
"name": "My Product",
"total": 1200,
"credit_type": {
"id": "2714e483-4ff1-48e4-9e25-ac732e8f24f2",
"name": "USD (cents)"
},
"starting_at": "2024-10-01T00:00:00+00:00",
"ending_before": "2024-11-01T00:00:00+00:00",
"unit_price": 100,
"quantity": 12,
"presentation_group_values": {
"region": "us-east-2"
}
}
],
"custom_fields": {},
"billable_status": "billable",
"breakdown_start_timestamp": "2024-10-01T00:00:00.000Z",
"breakdown_end_timestamp": "2024-10-02T00:00:00.000Z"
}
],
"next_page": null
}
```
If you update the scenario above to show the customer burning down against a \$200 prepaid commit, you see the commit deductions represented in the breakdown in addition to the usage line items. Use these fields if you want to show credit and commit burndown over time.
```json theme={null}
{
"data": [
{
"id": "5d960878-2553-5290-bddd-8def5f42532a",
"issued_at": "2024-11-02T00:00:00+00:00",
"start_timestamp": "2024-10-01T00:00:00+00:00",
"end_timestamp": "2024-11-01T00:00:00+00:00",
"customer_id": "140a7113-76c4-4ce2-9379-29fa3375d23c",
"customer_custom_fields": {},
"type": "USAGE",
"credit_type": {
"id": "2714e483-4ff1-48e4-9e25-ac732e8f24f2",
"name": "USD (cents)"
},
"status": "DRAFT",
"total": 0,
"external_invoice": null,
"contract_id": "95a390e3-b5c6-4264-8c7a-3583ec574c42",
"contract_custom_fields": {},
"line_items": [
{
"product_id": "d111fa1e-861e-48bb-82a6-3924d6cf0636",
"product_type": "UsageProductListItem",
"product_custom_fields": {},
"name": "My Product",
"total": 3700,
"credit_type": {
"id": "2714e483-4ff1-48e4-9e25-ac732e8f24f2",
"name": "USD (cents)"
},
"starting_at": "2024-10-01T00:00:00+00:00",
"ending_before": "2024-11-01T00:00:00+00:00",
"commit_id": "f3243ab9-dd22-4a6e-b4c3-7b2a0f8e8732",
"commit_segment_id": "ede54bc6-0c23-4d0b-a096-d6c79f38ff31",
"commit_type": "PrepaidCommit",
"commit_custom_fields": {},
"unit_price": 100,
"quantity": 37,
"presentation_group_values": {
"region": "ap-south-1"
}
},
{
"product_id": "d111fa1e-861e-48bb-82a6-3924d6cf0636",
"product_type": "UsageProductListItem",
"product_custom_fields": {},
"name": "Prepaid Credits applied",
"total": -3700,
"credit_type": {
"id": "2714e483-4ff1-48e4-9e25-ac732e8f24f2",
"name": "USD (cents)"
},
"starting_at": "2024-10-01T00:00:00+00:00",
"ending_before": "2024-11-01T00:00:00+00:00",
"commit_id": "f3243ab9-dd22-4a6e-b4c3-7b2a0f8e8732",
"commit_segment_id": "ede54bc6-0c23-4d0b-a096-d6c79f38ff31",
"commit_type": "PrepaidCommit",
"commit_custom_fields": {}
}
],
"custom_fields": {},
"billable_status": "billable",
"breakdown_start_timestamp": "2024-10-01T00:00:00.000Z",
"breakdown_end_timestamp": "2024-10-02T00:00:00.000Z"
}
],
"next_page": null
}
```
Use this pseudocode to pull together data from the Metronome invoice breakdown endpoint in your backend and present it to users as a stacked bar chart in your frontend.
```python Backend theme={null}
# Step 1: Extract the data from the Metronome API response
data = metronome_api_response['data']
# Step 2: Create a dictionary to store the processed data
processed_data = {}
# Step 3: Iterate through the data and organize it by date and region
for item in data:
date = item['breakdown_start_timestamp']
for line_item in item['line_items']:
region = line_item['presentation_group_values']['region']
value = line_item['total'] / 100 # Convert cents to dollars
if date not in processed_data:
processed_data[date] = {}
if region not in processed_data[date]:
processed_data[date][region] = 0
processed_data[date][region] += value
# Step 4: Create a list of unique regions and sort them
regions = sorted(set(region for date_data in processed_data.values() for region in date_data.keys()))
# Step 5: Prepare the data for charting
chart_data = []
for date in sorted(processed_data.keys()):
data_point = {'date': date}
for region in regions:
data_point[region] = processed_data[date].get(region, 0)
chart_data.append(data_point)
# Return chart data for frontend chart library usage
return chart_data
```
```javascript Frontend theme={null}
# Step 1: Fetch spend over time chart data from your backend
chart_data = fetch_from_backend('/api/customer_spend/:customer_id')
# Step 2: Extract unique regions from the chart data
regions = list(set(key.split('_')[0] for key in chart_data[0].keys() if key.endswith('_start')))
# Step 3: Use the chart_data to create your stacked bar chart
# The exact implementation depends on your charting library
# Example using Chart.js:
create_stacked_bar_chart(
data=chart_data,
x_axis='date',
y_axis='Spend (USD)',
stacks=regions,
colors=['#4e79a7', '#f28e2c', '#e15759'], # Assign colors to each region
title='Spend by Region Over Time'
)
```
## Embeddable dashboards
Share Metronome invoices and usage data with your customers through customizable embeddable dashboards.
### Invoice Dashboard
The invoice dashboard allows your customers to view their current and historical invoices (draft, finalized, and voided), up to 90 days old. For clients using Metronome's invoicing product, your customers can also manually attempt payment on outstanding invoices.
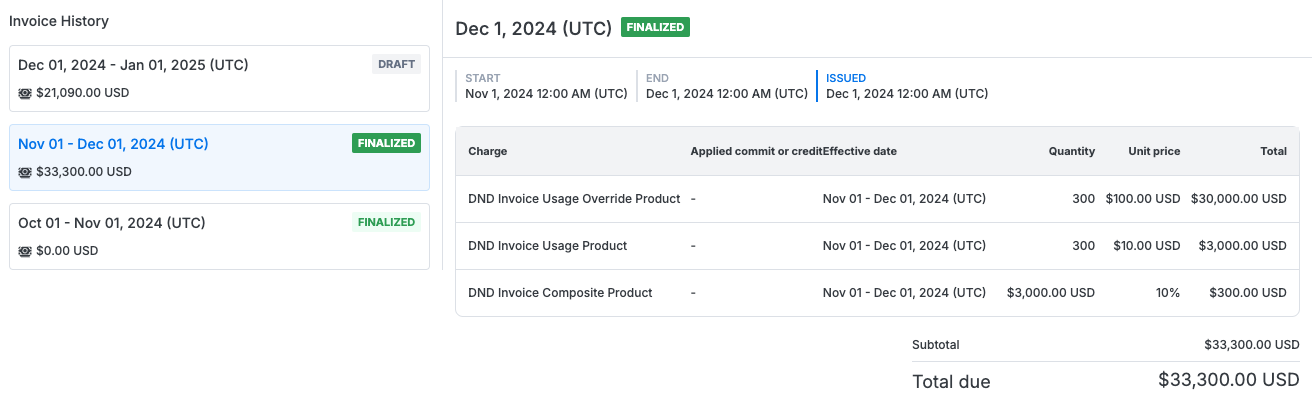 The invoice dashboard supports showing or hiding invoice line items with zero usage. To control this, provide the optional `dashboard_options` array with a key `show_zero_usage_line_items` and value of `true` or `false`. The default is `false`.
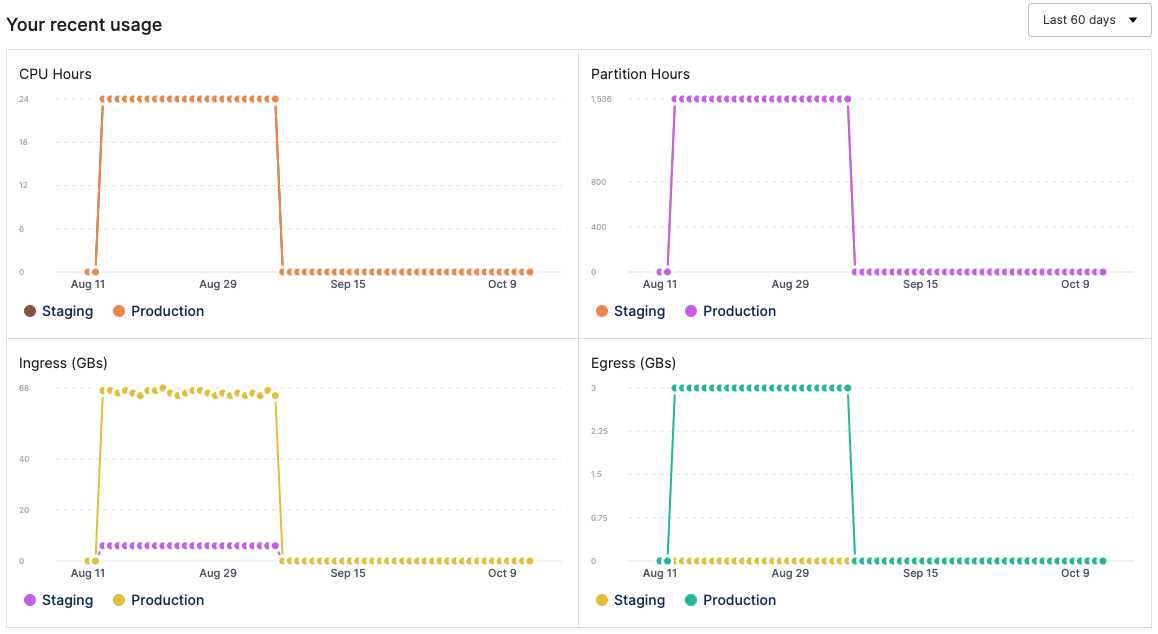
### Usage dashboard
The usage dashboard shows usage metrics attached to a customer's current contract for the past 30, 60, or 90 days.
The invoice dashboard supports showing or hiding invoice line items with zero usage. To control this, provide the optional `dashboard_options` array with a key `show_zero_usage_line_items` and value of `true` or `false`. The default is `false`.
### Usage dashboard
The usage dashboard shows usage metrics attached to a customer's current contract for the past 30, 60, or 90 days.
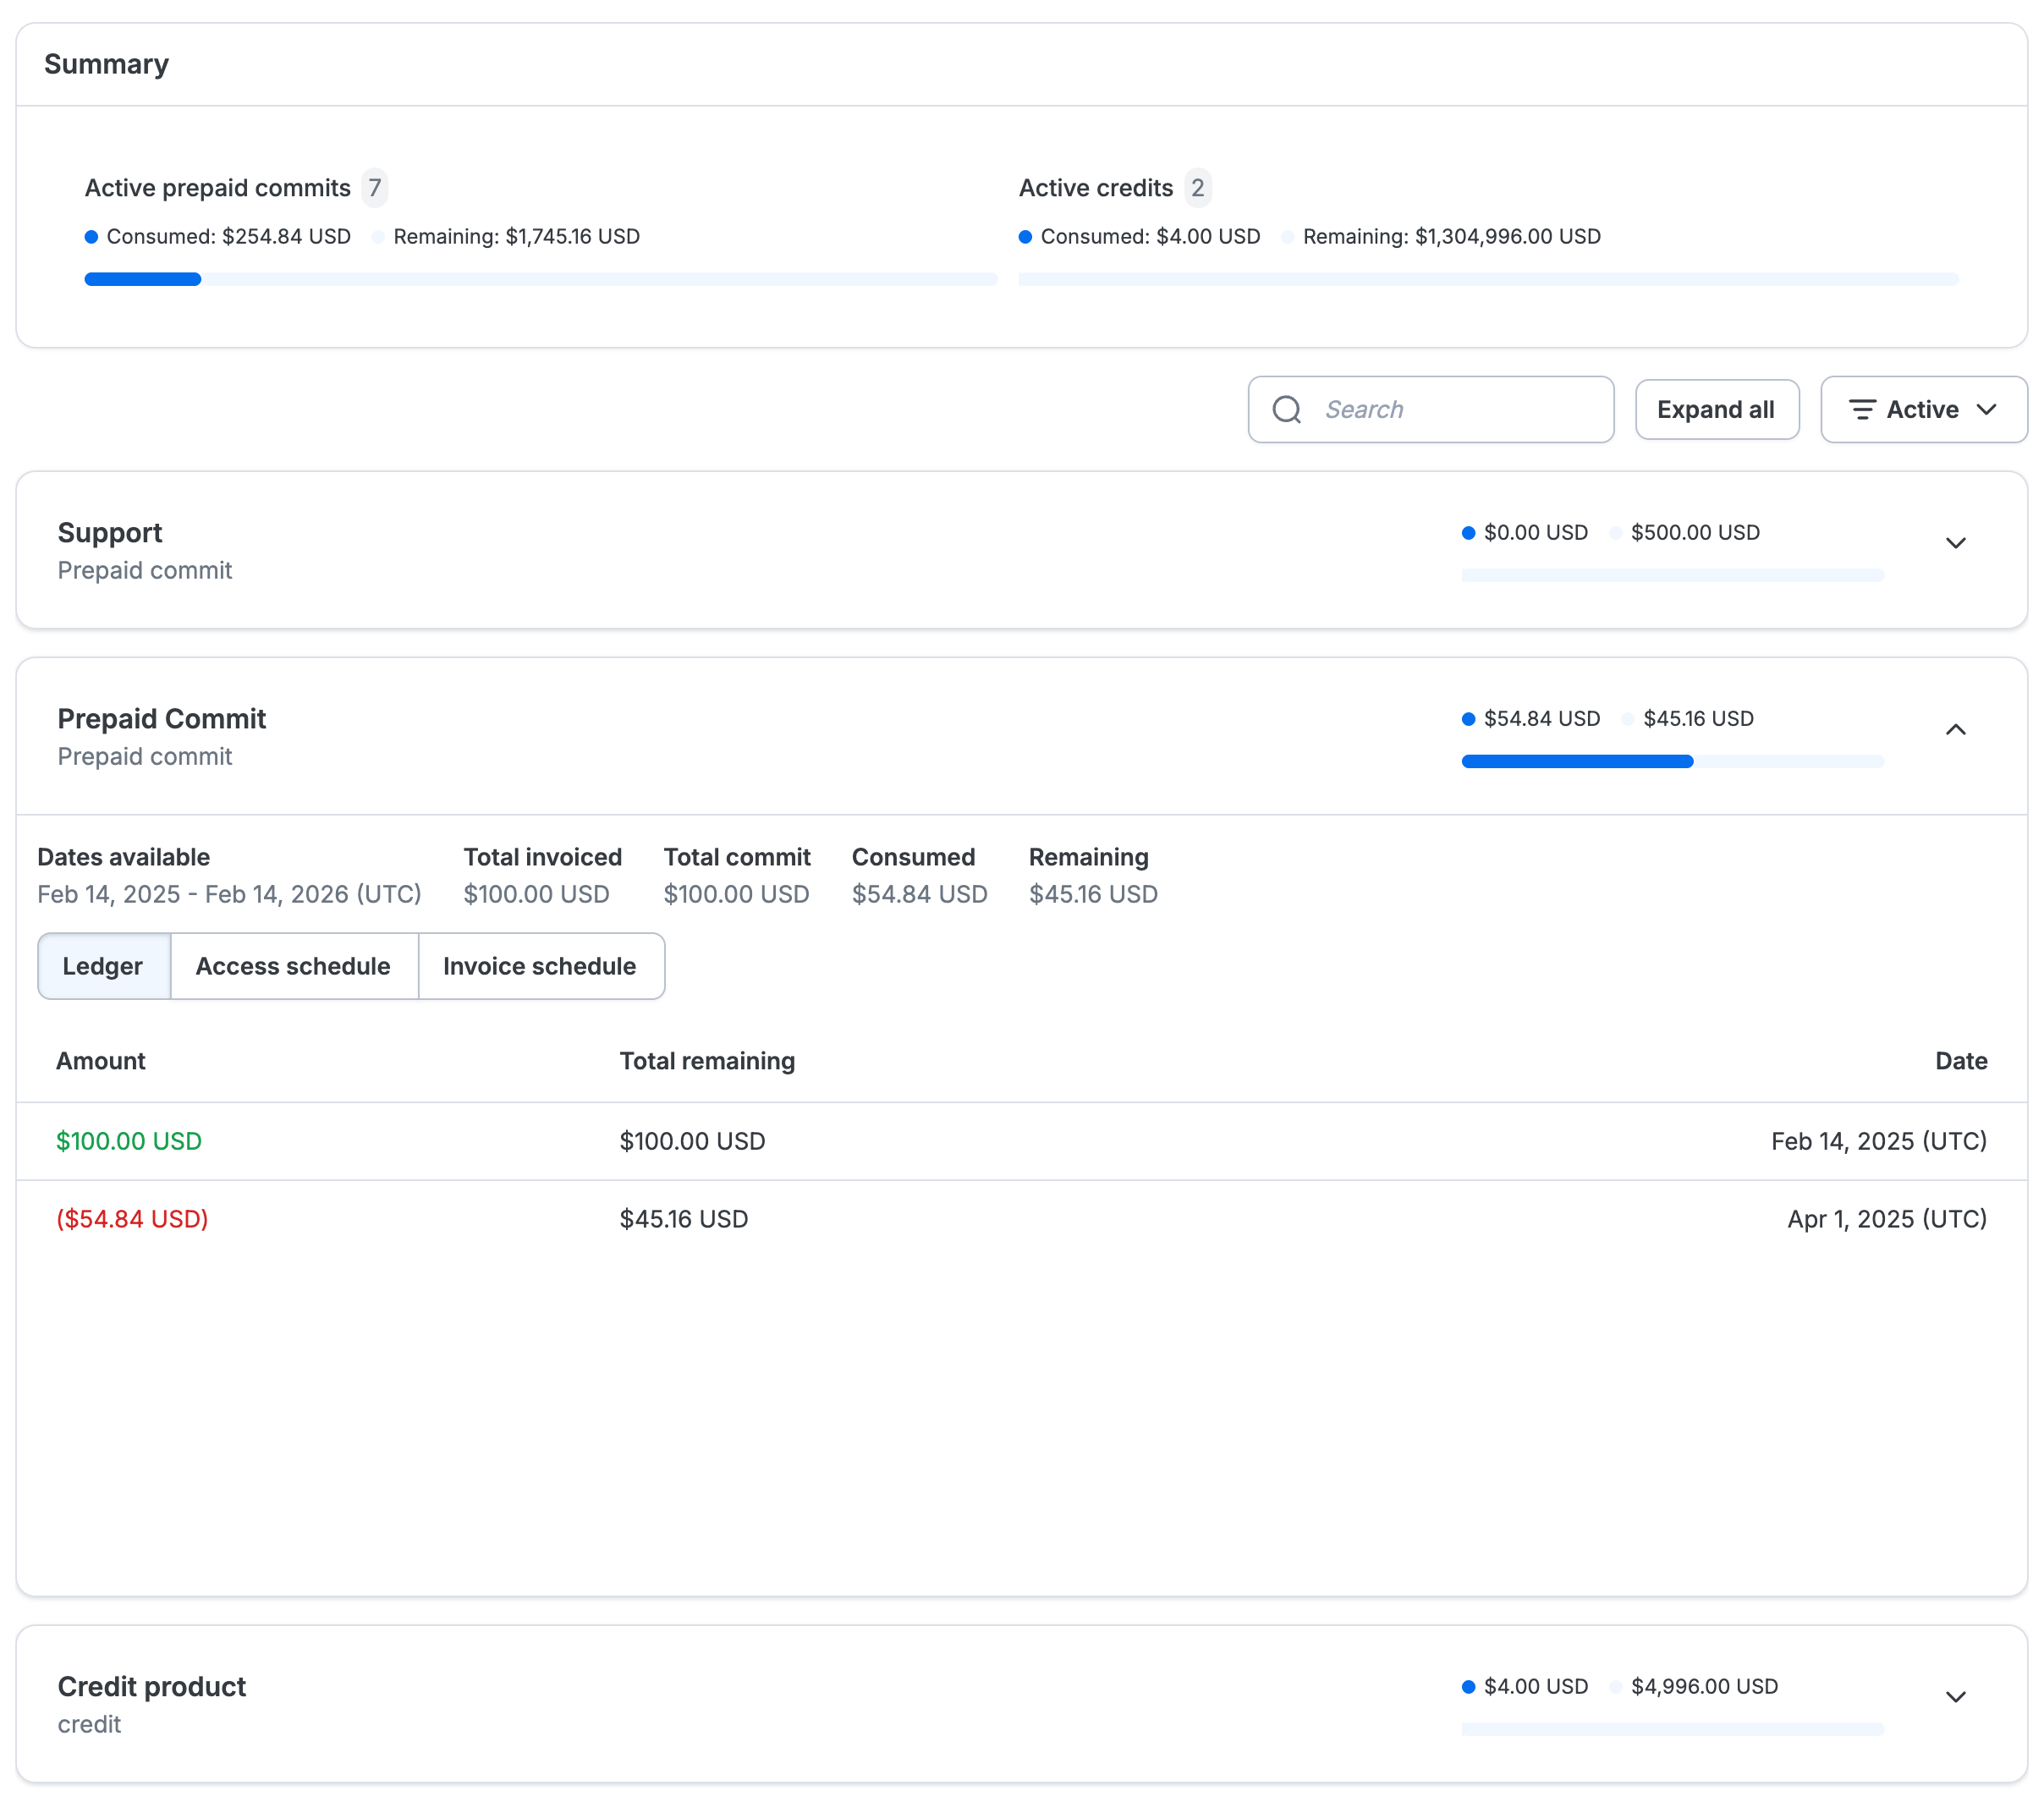
 ### Commits and credits dashboard
The commits and credits dashboard allows your customers to view their current and historical commit and credit grants, including:
* Remaining and historical balances
* Grant and deduction history
* Access schedules and expiration dates
### Commits and credits dashboard
The commits and credits dashboard allows your customers to view their current and historical commit and credit grants, including:
* Remaining and historical balances
* Grant and deduction history
* Access schedules and expiration dates
 ### Embed a dashboard
Use the Metronome API to retrieve an embeddable dashboard URL which can be displayed through an iframe within your internal billing UI.
1. Create an [API token](/api-reference/authorization) (if you don't already have one)
2. Use the [`/dashboards/getEmbeddableUrl`](/api-reference/customers/get-an-embeddable-customer-dashboard) endpoint to pass the `customer_id` and specify the dashboard you want to display.
### Override the color palette
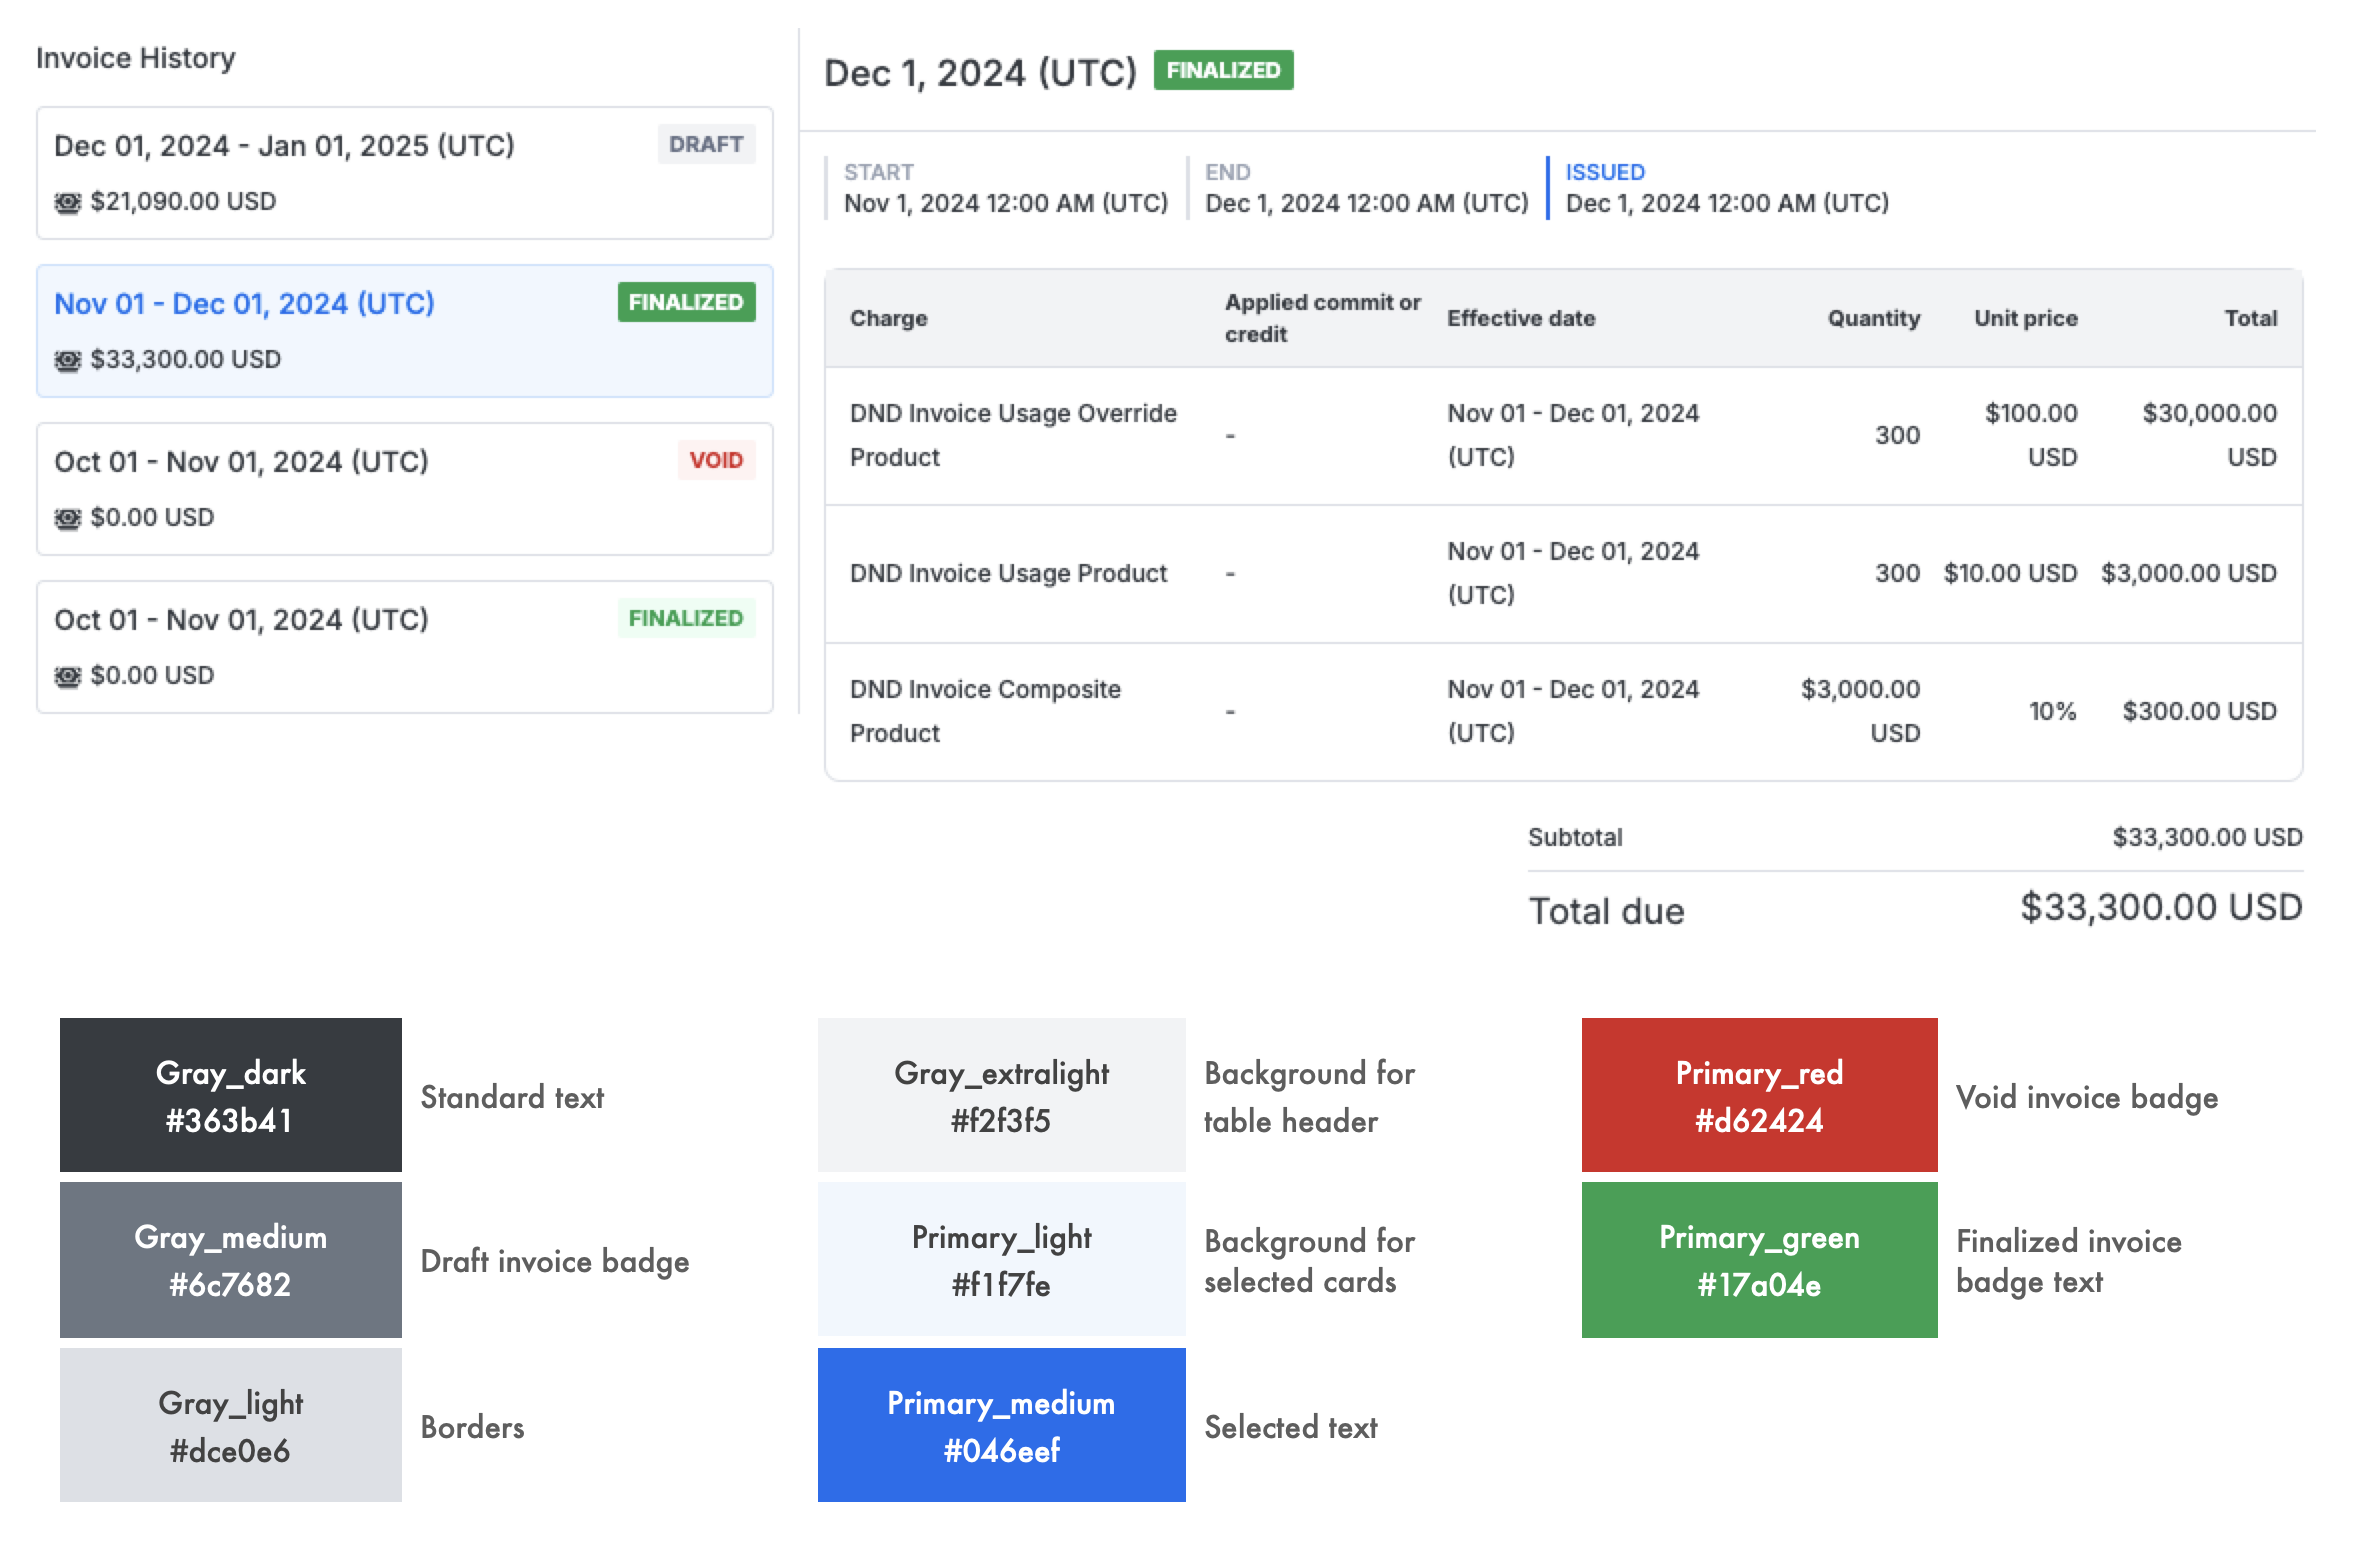
The `/dashboards/getEmbeddableUrl` endpoint supports a `color_overrides` array to override the color palette and match your design. See the full [list of colors](/api-reference/customers/get-an-embeddable-customer-dashboard).
The image demonstrates where Metronome uses each named color. For example, `gray_dark` applies to standard text; `primary_medium` applies to selected text.
### Embed a dashboard
Use the Metronome API to retrieve an embeddable dashboard URL which can be displayed through an iframe within your internal billing UI.
1. Create an [API token](/api-reference/authorization) (if you don't already have one)
2. Use the [`/dashboards/getEmbeddableUrl`](/api-reference/customers/get-an-embeddable-customer-dashboard) endpoint to pass the `customer_id` and specify the dashboard you want to display.
### Override the color palette
The `/dashboards/getEmbeddableUrl` endpoint supports a `color_overrides` array to override the color palette and match your design. See the full [list of colors](/api-reference/customers/get-an-embeddable-customer-dashboard).
The image demonstrates where Metronome uses each named color. For example, `gray_dark` applies to standard text; `primary_medium` applies to selected text.